New interactive tool visualizes Virginia’s oyster populations
Developed as part of an undergraduate project, the tool unveiled by William & Mary’s Batten School & VIMS brings to life almost 30 years of oyster survey data.
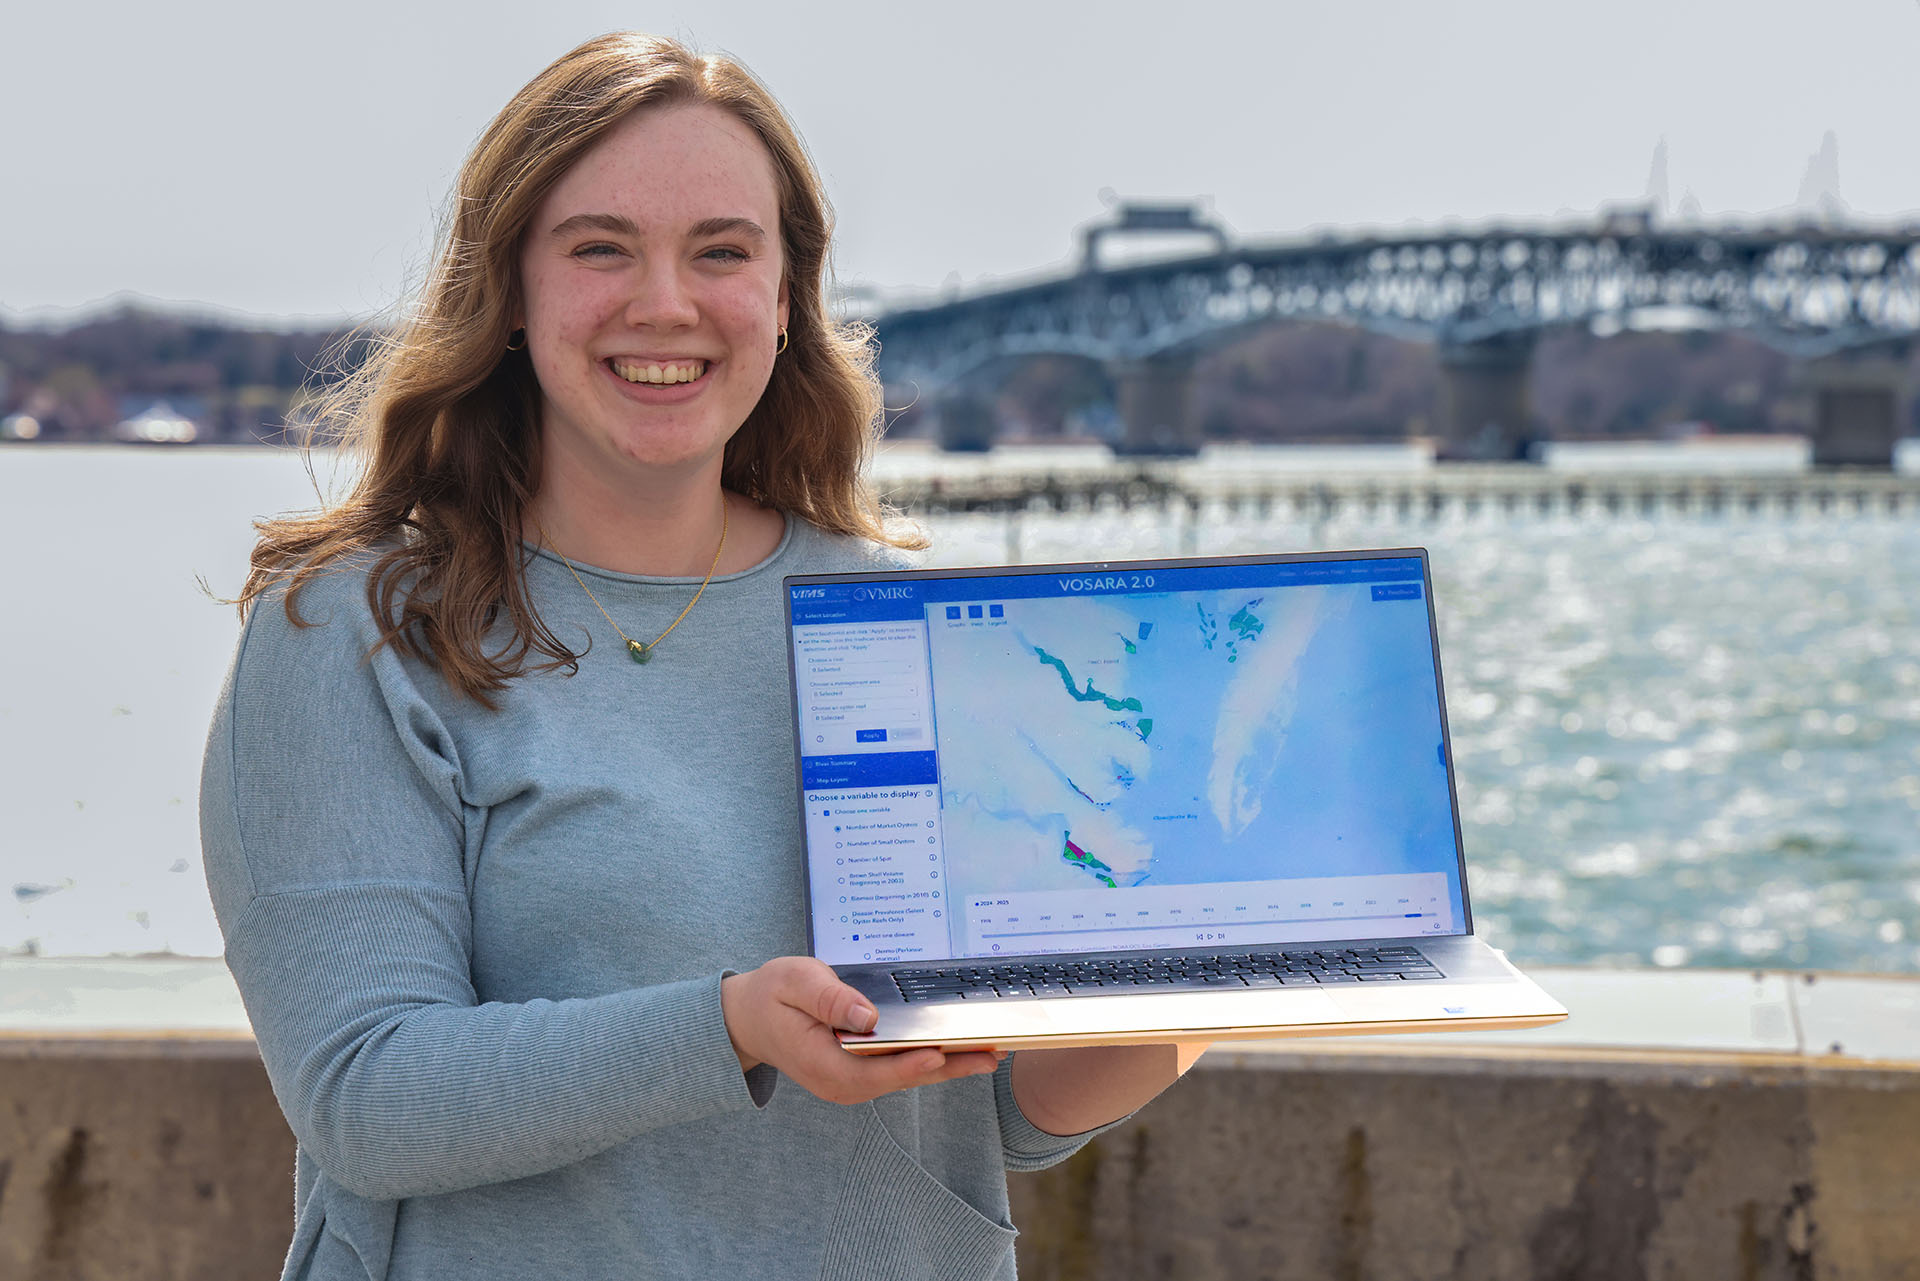 A new, interactive data platform developed at William & Mary’s Batten School of Coastal & Marine Sciences & VIMS in collaboration with the Virginia Marine Resources Commission (VMRC) is transforming how scientists, managers, watermen and the public understand Virginia’s wild oyster population. Perhaps the most impressive part, the tool was conceived as part of a Research Experience for Undergraduates (REU) project led by recent William & Mary alum Ellen Rowe ’25.
Named the Virginia Oyster Stock Assessment and Replenishment Archive (VOSARA) 2.0, it converts more than two decades of fishery-independent oyster survey data into a dynamic, GIS-based visualization tool. The platform allows users to explore changes in variables such as oyster abundance, shell volume and harvest status across Virginia’s public oyster grounds from 1998 to 2025.
“Ellen is essentially a genius for being able to take a dataset with 2 to 3 million data points and turn it into a GIS-based tool,” said Batten School & VIMS Professor Roger Mann when previewing the tool at VMRC’s Shellfish Management Advisory Committee (SMAC), which includes watermen, shellfish buyers, industry representatives and other interested parties. “When we asked for the funding for this project, the intent was that it would be designed for this group as well as the public so we can see the impact of our efforts.”
Rowe worked tirelessly with data managed by Senior Marine Scientist Melissa Southworth, who works alongside Mann in the Molluscan Ecology Laboratory at the Batten School of Coastal & Marine Sciences & VIMS. There was still work to be done as Rowe’s May 2025 graduation date neared, so Mann and Southworth used funds from their lab and a grant from VMRC’s Marine Fisheries Improvement Fund to hire Rowe as a GIS analyst through June 2026.
“The goal was to make something you could explore visually instead of having to dig through spreadsheets,” said Rowe, who also collaborated on the project with Professor Shannon White, associate director at William & Mary’s Center for Geospatial Analysis. “The main feature is a time slider that allows you to see changes at the reef level on a year-by-year basis. When you press play, you can watch the different variables change over time.”
 Turning decades of data into a living map
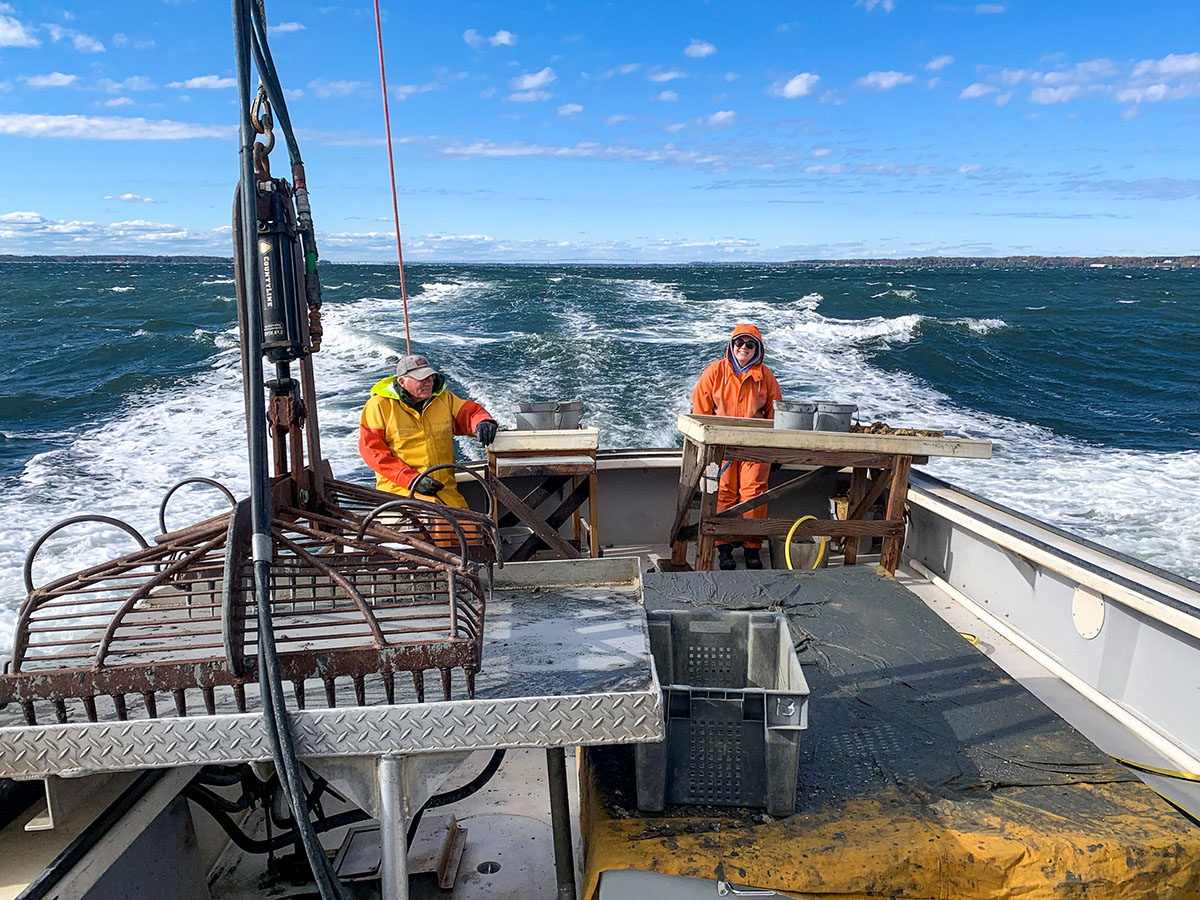
Since 1993, Batten School & VIMS scientists have worked in partnership with the VMRC to conduct annual fishery-independent surveys of public oyster reefs in Virginia’s portion of the Chesapeake Bay. Those surveys measure oyster abundance by size class, shell volume, recruitment and disease levels — creating one of the longest-running oyster monitoring datasets in the United States.
The original VOSARA website made those data publicly accessible, but it required Southworth to manually enter each year’s survey results and draft written summaries documenting changes at each individual reef. In addition, managers at VMRC would need to export the data and create graphs to examine individual factors.
“With VOSARA 2.0, it’s feasible that we can update the dataset within weeks of completing each year’s survey and those year-by-year changes will be automatically visualized for the end user,” said Southworth.
“We were victims of our own success,” said Mann. “There was so much information in those bar graphs that it was difficult to decipher anything beyond a broad trend.”
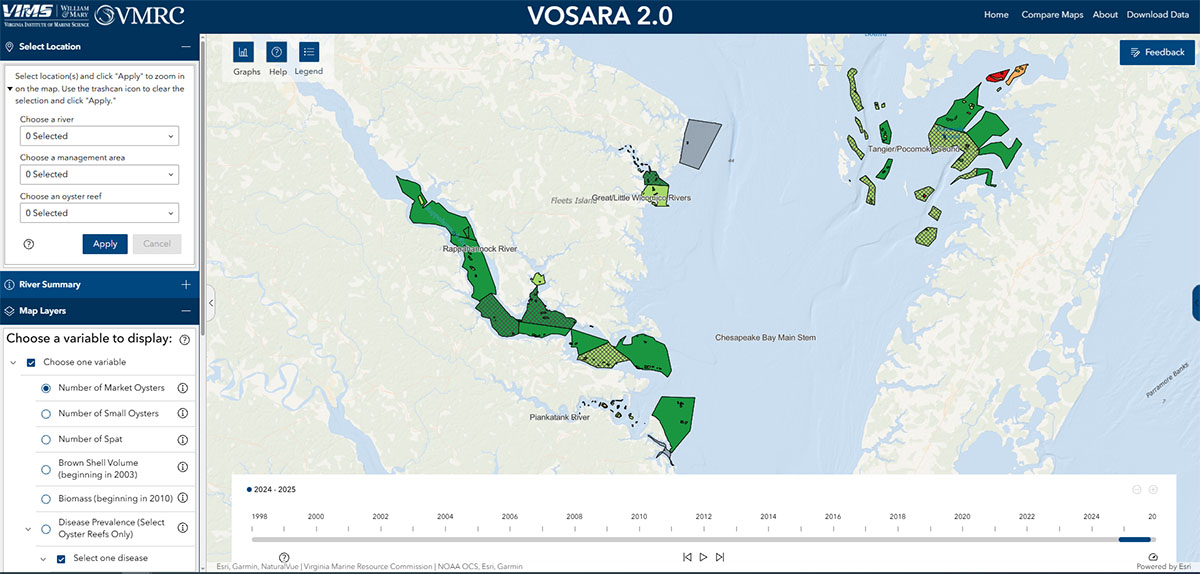
VOSARA 2.0 utilizes ArcGIS Online’s Experience Builder to replace the previous version’s static visuals and accompanying summaries. The tool centers on a map and time slider that allow users to condense decades of data into less than a minute.
Users can zoom from the Bay down to tributaries and individual reefs, toggle between data layers such as market oysters, small oysters, spat, and brown shell volume, while also viewing harvest closures and shell replenishment locations directly on the map. These variables represent different aspects of the reef’s condition. For example, spat are juvenile oysters and their numbers show the potential for future adults, while brown shell volume represents the “living” part of an oyster reef and is a primary indicator of whether the reef is stable, increasing or in decline. Automatically generated graphs and downloadable datasets allow for deeper analysis.
“Our main reason for doing this was to provide a more visually appealing way for managers to actually look at the stock,” said Southworth. “Instead of having to create their own graphs, they can just pull this up.”
Andrew Button, VMRC’s deputy chief of the Shellfish Management Division and head of the Conservation Replenishment Department, had become accustomed to and quite proficient with the data housed in the original VOSARA. However, VOSARA 2.0 provides some unique benefits for assessing management decisions.
“Our management decisions are not made by just one person, so it’s especially helpful for being able to present information to SMAC, legislators and others at VMRC. It can help speed up the decision-making process without losing any of the information that we know,” said Button.
 Making management visible
Button points to several management examples that are clearly illustrated by VOSARA 2.0: the rotational harvest strategy implemented in the Rappahannock River in 2007 and in other tributaries in later years, and changes to harvest effort strategies around 2016 and 2017.
Under the rotational harvest system, reefs are opened for harvest, then replenished with clean oyster shell and closed for two years before reopening. Replenishing reefs with oyster shells provides additional substrate to which juvenile oysters can affix while mitigating the impacts of commercial harvests. Harvest effort strategies are aimed at ensuring sustainability by regulating things such as daily bushel limits or the type of gear used by watermen. Using the time slider, users can see management areas alternate between open and closed and watch oyster abundance increase over time.
“Looking at those big transitions from 2006 forward, especially in the Rappahannock River, you see the resource change in a positive way,” said Button. “Additionally, replenishment decisions are based on this survey data. We can target the reefs that need it most, and you can visualize that happening with this tool.”
 User-tested, designed to last
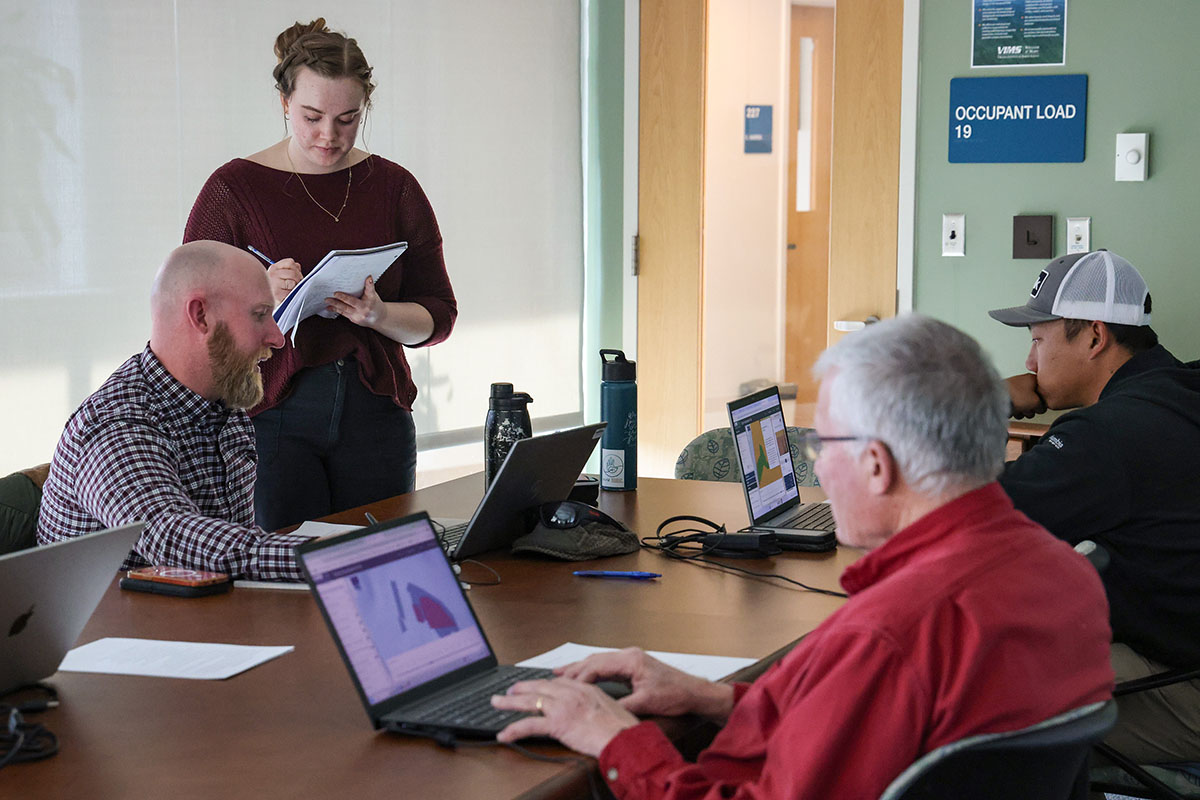
As VOSARA 2.0 neared completion, Rowe held a user experience workshop with colleagues at the Batten School & VIMS and VMRC where future users tested the functionality and provided feedback on everything from color choices to the naming of different variables in relation to public understanding.
The tool was also presented to members of VMRC’s Shellfish Management Advisory Committee, who were later provided with a link for further testing.
“We wanted to make sure that we tested the tool with some of its primary users before making it publicly available,” said Rowe. “I also developed extensive documentation so that Roger, Melissa and others would be able to maintain it well into the future.”
After two years of development, VOSARA 2.0 is ready to guide Virginia’s ongoing management of one of its most important natural resources. Its launch stands as an example of the ingenuity and possibilities that arise when combining academics at William & Mary with Virginia Institute of Marine Science’s scientific advisory role.
“This tool is a great advertisement for what an undergraduate can do when you give them access to long-term programs and real data,” said Mann. “To develop this type of tool while launching a bright career — all thanks to an initial $8,000 in National Science Foundation funding for an REU — is quite a return on investment.”