

Striped Bass Index
Current Index Trend for Striped Bass
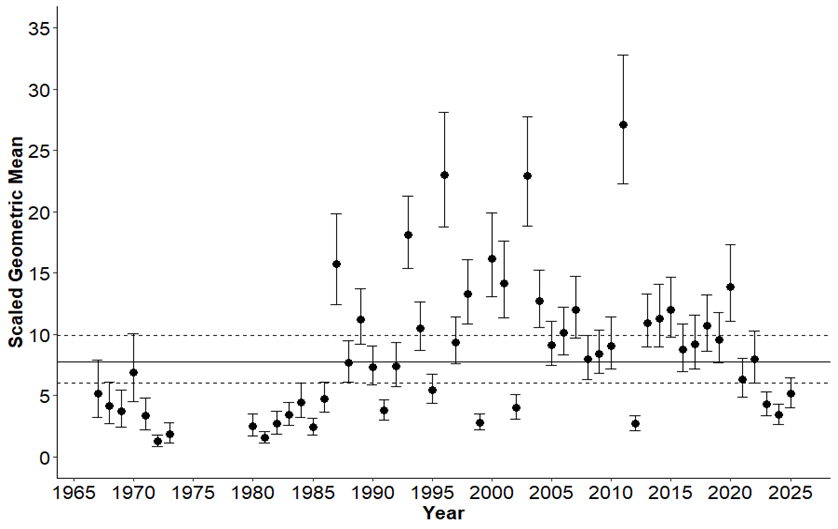
Indices Calculated: Age 0
Rounds Used: 1-5
Stations Used- Rappahannock River: 28, 37, 44, 50, 55
- Pamunkey River: 42, 45, 50
- Mattaponi River: 33, 41, 44, 47
- James River: 29, 36, 46, 56
- Chickahominy River: 01, 03
Method for developing an index
For a given species, an index is created by selecting both spatial and temporal components. The spatial component is determined by the range of the animal and catch rates across the sampling area. The temporal component is selected as a three- to four-month window when the species is most fully recruited to the estuary and available to the sampling gear. With both the spatial and temporal components selected, the data are statistically treated to produce a "geometric mean catch per seine haul," or more simply put, an average catch rate. With several years of data, the results can provide a very informative picture of a species' health and spawning success in Chesapeake Bay.
Other Indices
Although the Striped Bass abundance index is the primary goal of the Virginia Institute of Marine Science's Juvenile Striped Bass Seine Survey, the survey provides valuable data on other ecologically and commercially important species as well. Because the survey is not designed to target these species, subsets of the data are taken to reflect stations and times of year appropriate to their behavior and ecology.
Abundance indices are calculated for White Perch, Atlantic Croaker, Spot, American Shad, Blueback Herring, Alewife, Atlantic Silversides, Inland Silversides, Banded Killifish and Spottail Shiner using the following criteria:
Year classes are assigned by length distribution for species
As only striped bass are individually assigned year class values, year classes for all other species must be assigned by analysis of length distributions. Length distributions (using several years of data) are plotted by round and presented temporally. Length cutoff points are determined from these graphs and are used to separate year classes.
- Age 0 = sampling year and the year class are the same
- Age 1 = sampling year and the year class values are offset by one year
- Age 1+ = an undistinguishable (by length frequency analysis) mixture of fishes that are age 1 and older
- All Ages = year class is unknown
Stations used in index calculations are based on historical catch per unit effort (CPUE) as well as known salinity tolerances
As different species are abundant in different geographical waters, it is not appropriate to use all stations sampled for all species (e.g., don't use freshwater stations for a species that only occurs in saltwater). To determine which stations to use for each species, historical mean abundance at each station is plotted and those regions with the highest CPUE are selected. The stations listed on each Species Information page in the report are those stations presently sampled (since 1989) that have the highest CPUE for the species. However, over the historical span of the survey, stations have been moved, added and dropped. The actual historical station list used for each species may be slightly different.
Historical "rounds" are redefined to correspond with current "rounds"
Species use the regions sampled in a temporal manner. That is, abundance of a species is not necessarily constant throughout the sampling period each year. Further, historically, the "rounds" have not defined a specific period of time year after year. For example, round 2 in one year may refer to the last two weeks in July, while in another year, round 2 may refer to a period in late August. The number of rounds also were not consistent in the historical data. Therefore, for all species except Striped Bass, the historical rounds are redefined to the present round definition (5 rounds defining two-week periods beginning in early June or July) and data for each species are subset to use the rounds of maximum CPUE.
Different sizes/ages of a species are susceptible to being caught in the seine at different times
All species do not reproduce at the same time and are susceptible to being caught in the beach seine gear at different life stages. The length-frequency progressions are examined, and combined with knowledge of the reproductive timing for each species to determine which age cohorts are sampled during a given month/round.
Indices are not calculated for all species caught by the seine
Some species and some age cohorts of species are not caught in large enough abundance to calculate a reliable or accurate index.