'Catch the King' on Oct. 10-12, 2025
VIMS' Model-Predicted Maximum Flooding Extents compared with Wetlands Watch's Sea Level Rise Mobile App Observations for the King Tides during October 10-12, 2025
"Catch the King" is a community science GPS data collection effort focused on coastal Virginia, USA, that seeks to interactively map the King Tide's maximum inundation extents. The goal is to validate and improve predictive model accuracy for future forecasting of increasingly pervasive "nuisance" flooding. Catch the King 2025 took place on the weekend of October 10-12, 2025, and was the 9th year of the annual tidal inundation mapping event.
Catch the King was founded as a collaborative effort to give members of the public an opportunity to engage personally in climate change adaptation. While the development of the Sea Level Rise app was led by Wetlands Watch and local tech company, Open Health Innovations, the idea for creating a statewide program stems from the creative minds of Wetlands Watch’s former Executive Director, Skip Stiles, retired Virginian-Pilot reporter, Dave Mayfield, and Virginia Institute of Marine Science (VIMS) assistant professor, Dr. Derek Loftis.
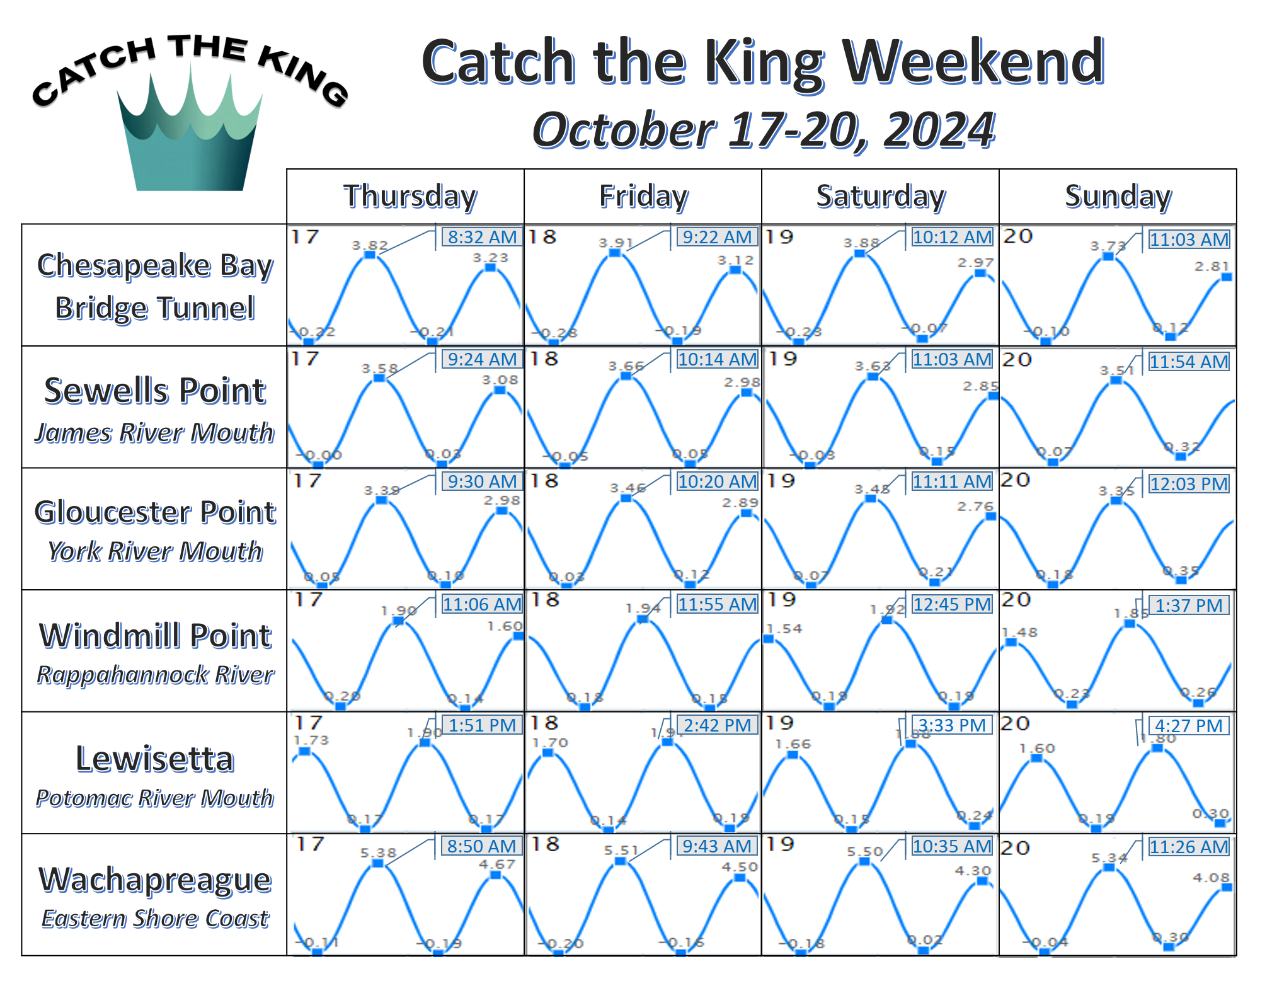
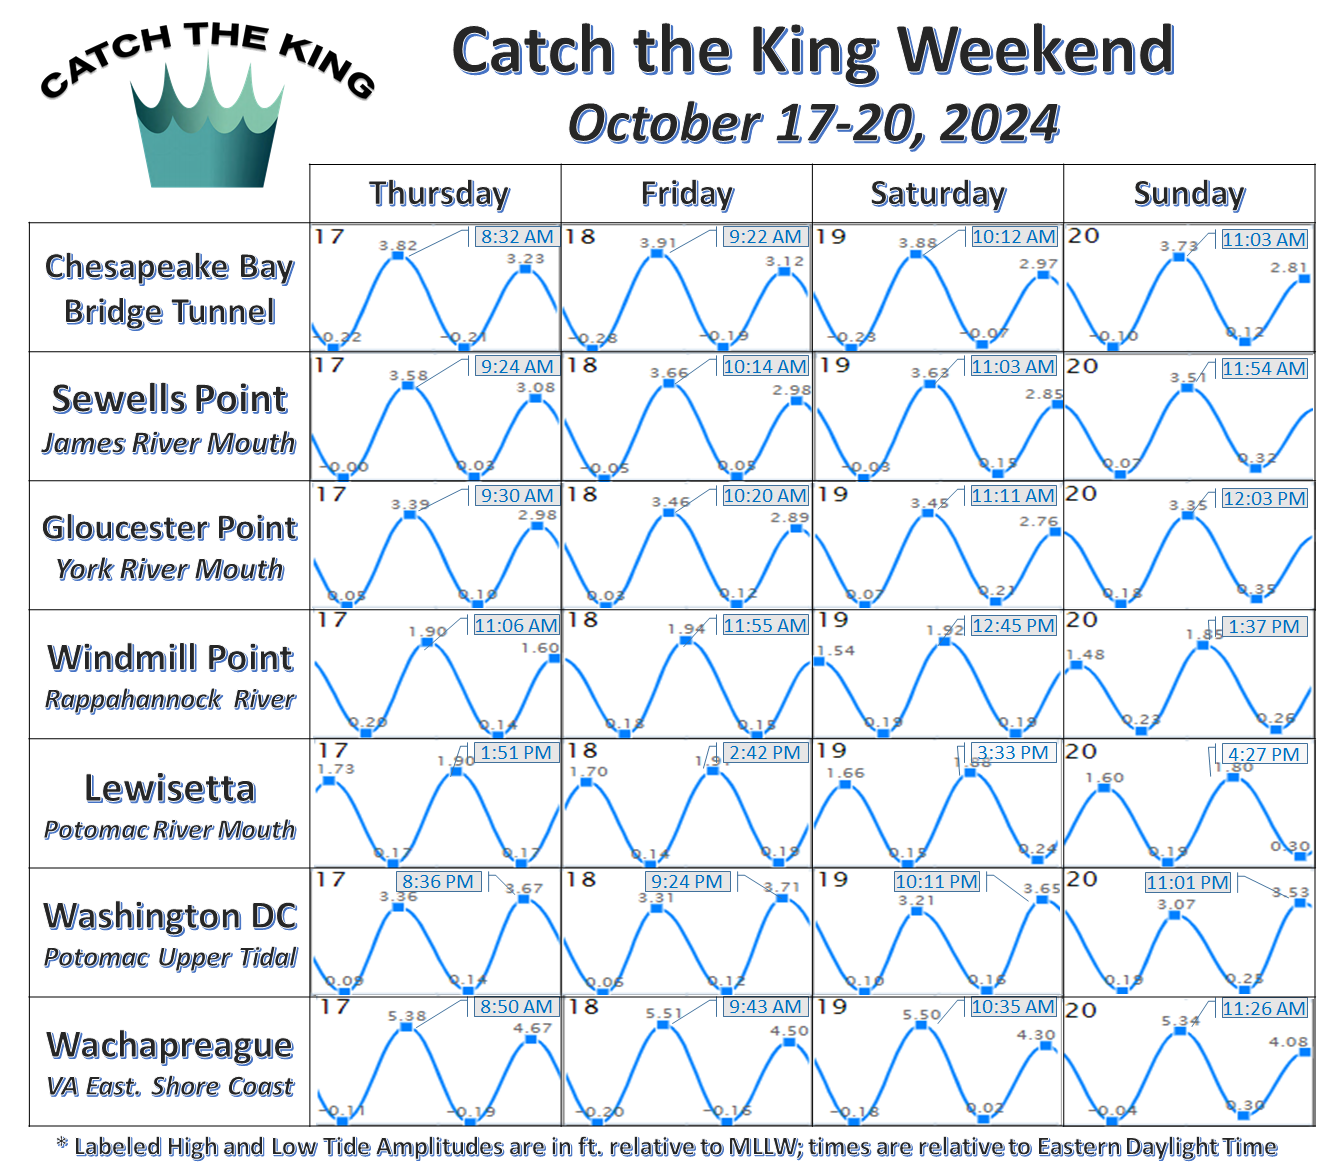
The 2025 Virginia tidal inundation calendar is featured below identifying relevant moon phases and it highlights periods of amplified high tides (typically between 3.0-3.5 ft. above MLLW in South Chesapeake Bay) or even higher king tides (usually greater than 3.5 ft. above MLLW in South Chesapeake Bay). 2025's VA tidal flooding calendar is featured below to provide more specific details on each tidal flooding event. Please download and save this 2025 Virginia Fall Tidal Flooding Calendar (Interactive links embedded in PDF) for your reference:
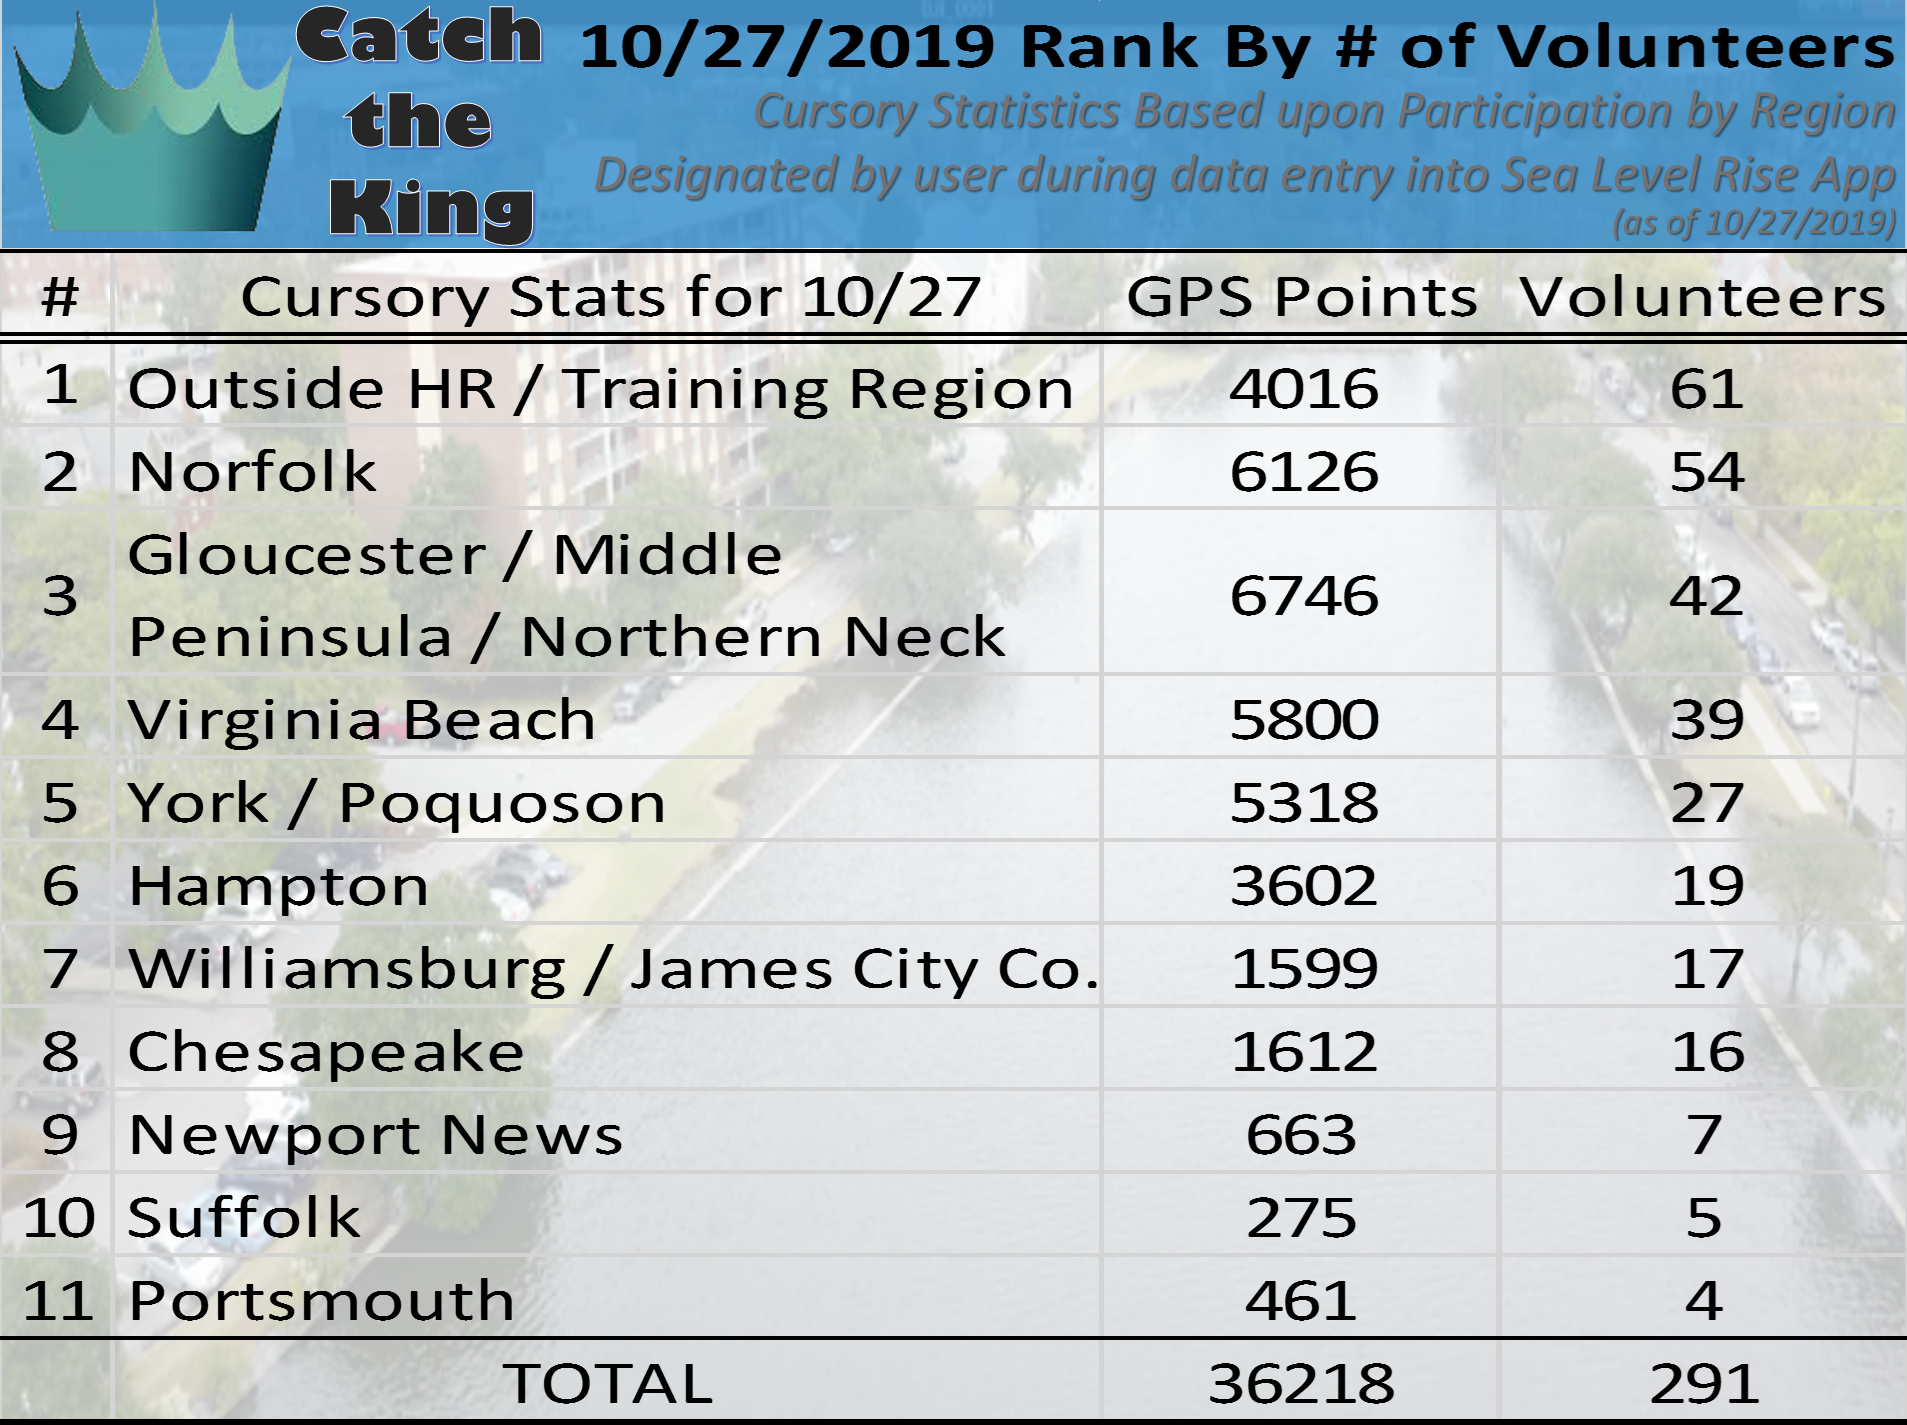
Throughout the year, trained tidal flood mappers use the free Sea Level Rise mobile application (iOS / Android) developed by Wetlands Watch and Open Health Innovations (formerly Concursive) to walk the high water lines in public spaces near them to digitally trace GPS contours of the maximum extent of tidal flood waters. These data are shared publicly after the end of the mapping event and used as a public annual tidal calibration for the forecast predictions generated from VIMS' Tidewatch Map. Annually, a live tidal calibration of the forecasts driven from the Center for Coastal Resources Management's SCHISM hydrodynamic model (developed by Dr. Joseph Zhang) is conducted by the trained participatory scientists engaged with Catch the King, and analyzed by Dr. Loftis at VIMS.
{{youtube:large|o98s9pD8Uk4, See Catch the King's Recent Media Coverage on Fox Weather.}}
In 2025, Catch the King took place on the weekend of October 10-12, during some of the highest astronomical tides of the year, which were harmonically forecasted to be 3.22-3.63 ft. above MLLW at Sewells Point in Norfolk, VA. The king tide will occur at many different times and different peak amplitudes at coastal places throughout the Commonwealth of Virginia's coastal region, yet each is forecasted to be the highest tides of the year for those areas.
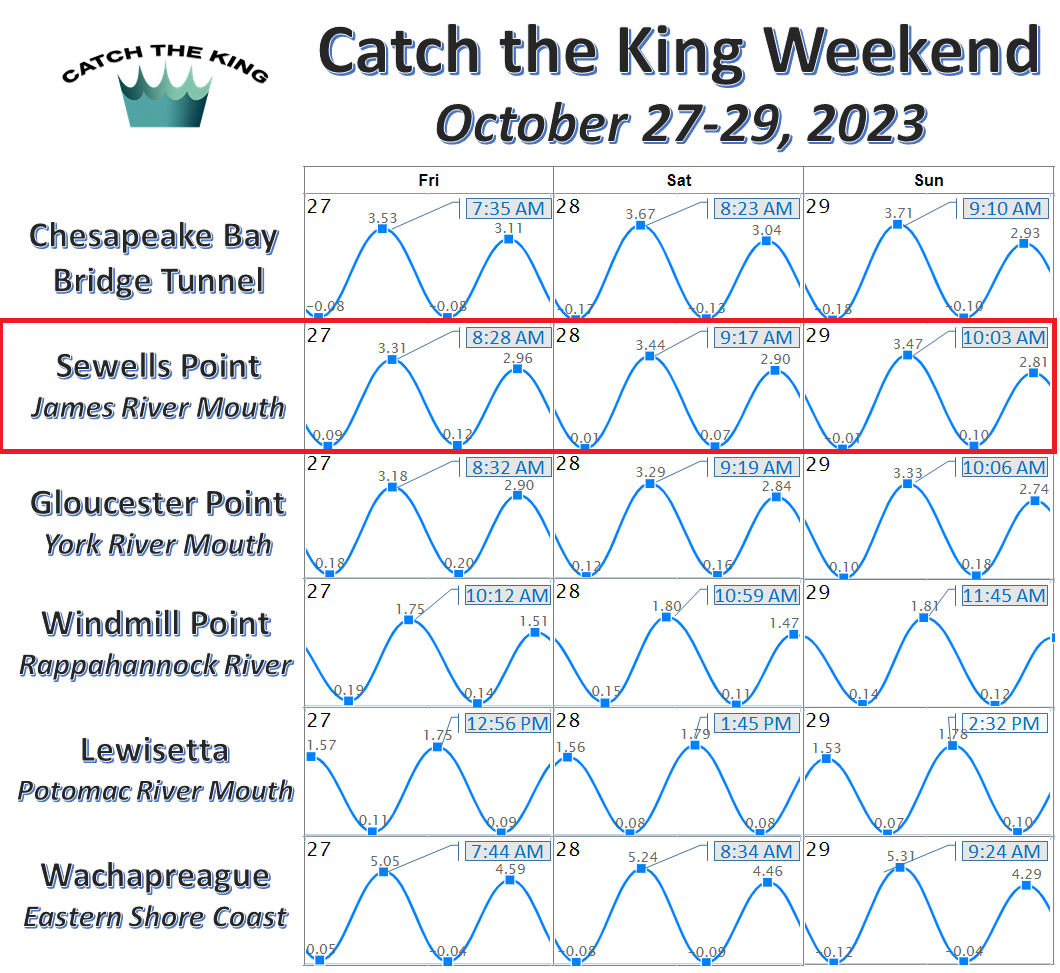
Check out the King Tide Weekend Calendars for Virginia and North Carolina Below:
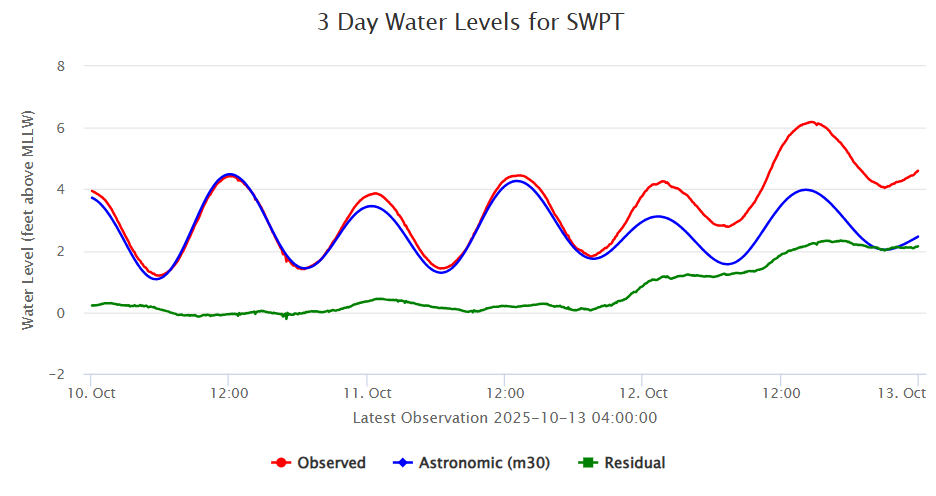
Catch the King 2025 took place over the period of an entire weekend (Friday, October 10th, Saturday, October 11th, and Sunday, October 12th). The weather on Friday, October 10th, was characteristic of tidal flooding, with minimal influence from atmospheric anomalies, but influences from a nor'easter crept in just off the Virginia and North Carolina shore, introducing sporadic rain on Saturday, October 11th. October 12th saw significant sustained wind speeds from the NE of 20 mph (with gusts up to 50 mph) throughout most of the Lower Chesapeake Bay coastal tributaries, and continued light rainfall during the king tide weekend. The 3-day tidal time series plot below from VIMS' Tidewatch Charts service features data from NOAA's Sewells Point, VA tide gauge throughout the 2025 Catch the King Weekend to help illustrate these forces at play. These resulted in peak tidal amplitudes of 4.43 ft. at 12:12 PM on Friday, October 10th; 4.45 ft. at 1:06 PM on Saturday, October 11th, and 6.18 ft. above MLLW at 2:00 PM EDT on Sunday, October 12th. The tide chart below showcases water level observations in red, harmonic tidal predictions in blue, and the tide-subtracted residual impacts of atmospheric influences of wind and rain on water levels in green:
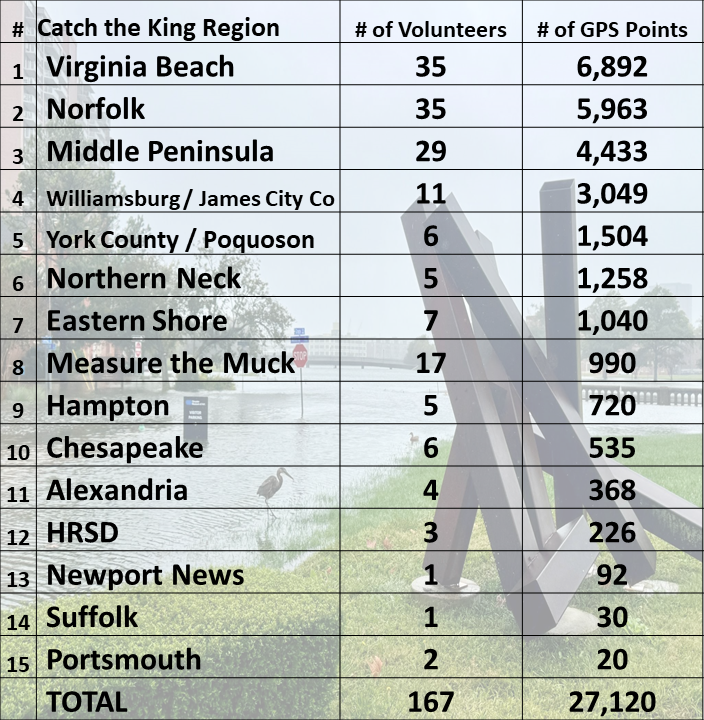
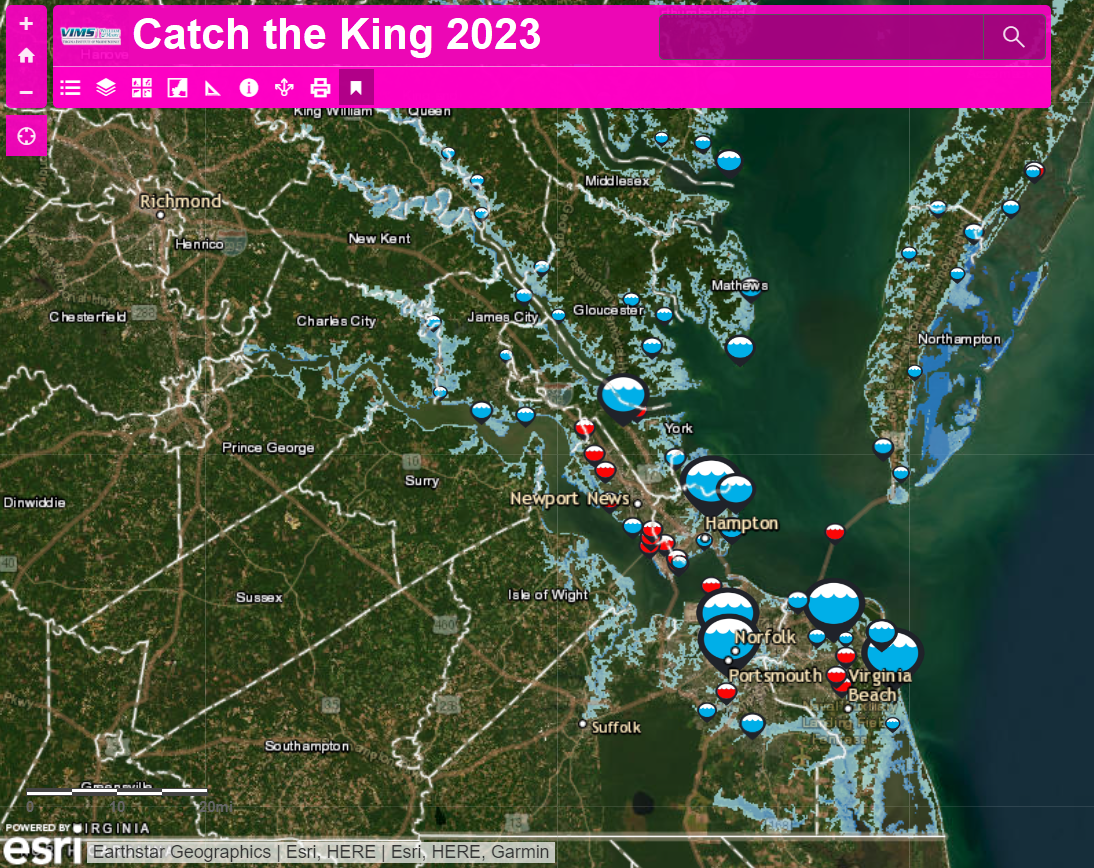
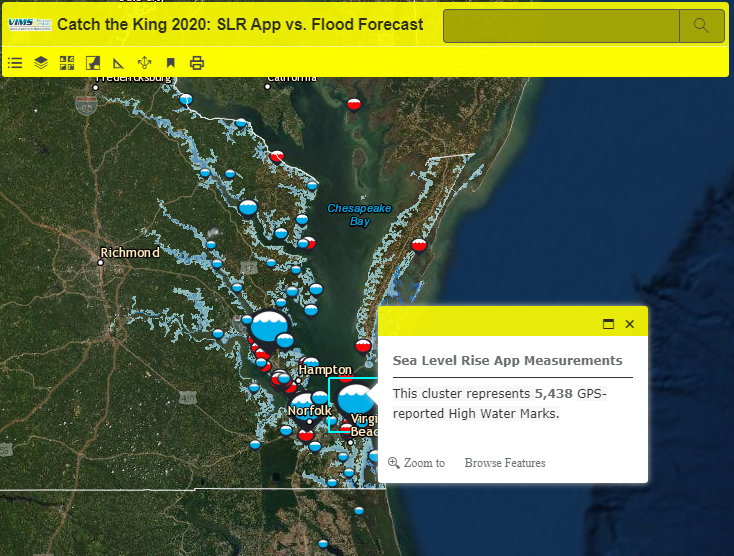
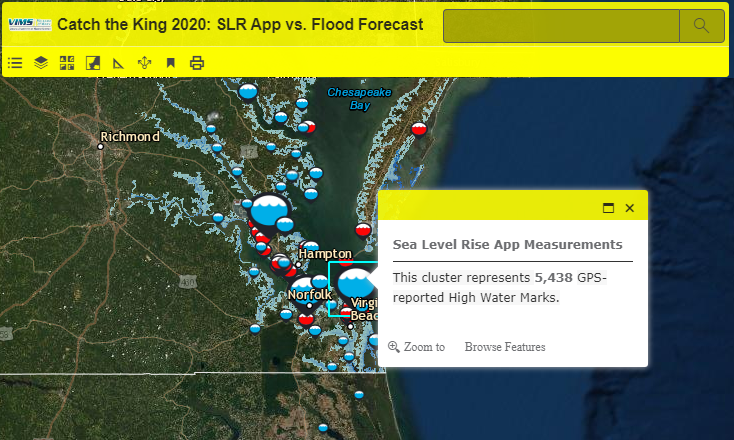
The 2025 King Tide inundation forecast map from VIMS' Center for Coastal Resources Management has been updated with all of the GPS maximum flooding extent data points. These data were retrieved from the 2025 Catch the King Tide mapping regions from the Sea Level Rise mobile app that were designated for this year's flood mapping event. An interactive map of the maximum flooding extent GPS data collected from this year's king tide event is featured below, overlaid with the street level inundation model's predictions for the king tides on Friday, October 10th, and Saturday, October 11th. An additional separate flood map will be added soon to include the impacts from the coastal nor'easter's 20+ mph winds and rain + king tides on Sunday, October 12th soon, compared with archived data from the CCRM's 36-hr. storm tide inundation forecasts via VIMS' Tidewatch Map, to better match the changing weather conditions throughout the king tide weekend:
| View Interactive Map in New Window |
|
Map Legend:
|
More Information on Catch the King and Sea Level Rise
"Catch the King" is a community science GPS data collection effort centered in Hampton Roads, VA, that seeks to interactively map the King Tide's maximum inundation extents. The goal is to validate and improving predictive model accuracy for future forecasting of increasingly pervasive "nuisance" flooding. Tracking tidal flooding is important, as it gives us a tangible glimpse into the anticipated height of mean tides less than half a century from today. As shown in the interactive plot below, Norfolk in Hampton Roads, VA, has the highest rate of relative SLR acceleration on the US East Coast, as noted in this 2018 VIMS Report.
Interested volunteers can participate in future citizen science collection events by downloading the free "Sea Level Rise" application onto their smartphone, and using the app to trace the high water line from varying locations where they observe inundation. The data will be collected and used to help scientists, educators, and community leaders better understand the risks imposed by the rising tide. To learn more about how the Commonwealth Center for Recurrent Flooding Resiliency is working to help address these issues, visit: http://www.floodingresiliency.org/.
Download Catch the King 2025 Data:
Event data will be publicly posted here (once reviewed and finalized) after Catch the King for interested parties to access and download directly.
Attributions: Volunteers of 'Catch the King' Tide collected these data using the Sea Level Rise mobile application developed by Wetlands Watch and Open Health Innovations. Catch the King was sponsored and supported by the Hampton Roads Sanitation District and AECOM, WHRO Public Media, The Virginian-Pilot, the Daily Press, and the Commonwealth Center for Recurrent Flooding Resiliency (CCRFR) and orchestrated/managed by Wetlands Watch's Volunteer Coordinator, Stephanie Letourneau, and a dedicated team of tide captains and teachers. GPS volunteer data were shared with VIMS for public dissemination via SeaRisingSolutions.com and some schools and volunteers directly.
Suggested citations for this viewer and these data:
Loftis, J.D., Mitchell, M., Schatt, D., Forrest, D.R., Wang, H.V., Mayfield, D., and Stiles, W.A. 2019. Validating an Operational Flood Forecast Model Using Citizen Science in Hampton Roads, VA, USA. Journal of Marine Science and Engineering. 7, 242. URL
Loftis, J.D., Katragadda, S. 2018. Crowdsourcing Hydrocorrection: How Tidewater Virginia Caught the King Tide. ESRI GIS User Conference, UC293 - Citizen Science at Work. San Diego, CA. URL
Simoniello, C., Jencks, J., Lauro, F.M., Loftis, J.D., Weslawski, J.M., Deja, K., Forrest, D.R., Gossett, S., Jeffries, T.C., Jensen, R.M., Kobara, S., Nolan, L., Ostrowski, M., Pounds, D., Roseman, G., Basco, O., Gosselin, S., Reed, A., Wills, P., and Wyatt, D. 2019. Citizen-Science for the Future: Advisory Case Studies From Around the Globe. Frontiers in Marine Science 6, p.225. URL
Loftis, J.D., Mayfield, D., Forrest, D., Stiles, W. 2018. A Geospatial Analysis of +50,000 Citizen-Science collected GPS Flood Extents and Street-Level Hydrodynamic Model Forecasts during the 2017 King Tide in Hampton Roads, VA. MTS/IEEE Oceans 2018 - Charleston, SC. URL