
Real-time Estimates of Hypoxic Water Volume
Chesapeake Bay
Quick SummaryScientists estimate the amount of hypoxia in the Chesapeake Bay using a metric called the "hypoxic volume," which is the volume of water in the Bay with a dissolved oxygen concentration less than 2 milligrams per liter (mg/L). This volume represents an approximate size of the Dead Zone in the Bay. In the spring, the size of the summer dead zone is forecast based on the amount of nutrients supplied to the Bay. Once or twice a month, boats are used to collect observations and estimate the hypoxic volume. However, both these methods provide very infrequent estimates of hypoxic volume. The Chesapeake Bay Environmental Forecast System estimates the hypoxic volume every day. The daily hypoxic volume forecasts are used to calculate the total annual hypoxic volume throughout the year. This metric provides a single number that represents the severity of hypoxia in a given year. The model was used to estimate hypoxic volume for each day from 1985 through 2025 for comparison with 2026. These daily estimates are based on complex computer models that continue to be improved; therefore, past estimates may be updated as improvements are made to the models. |
2026 Dead Zone Size
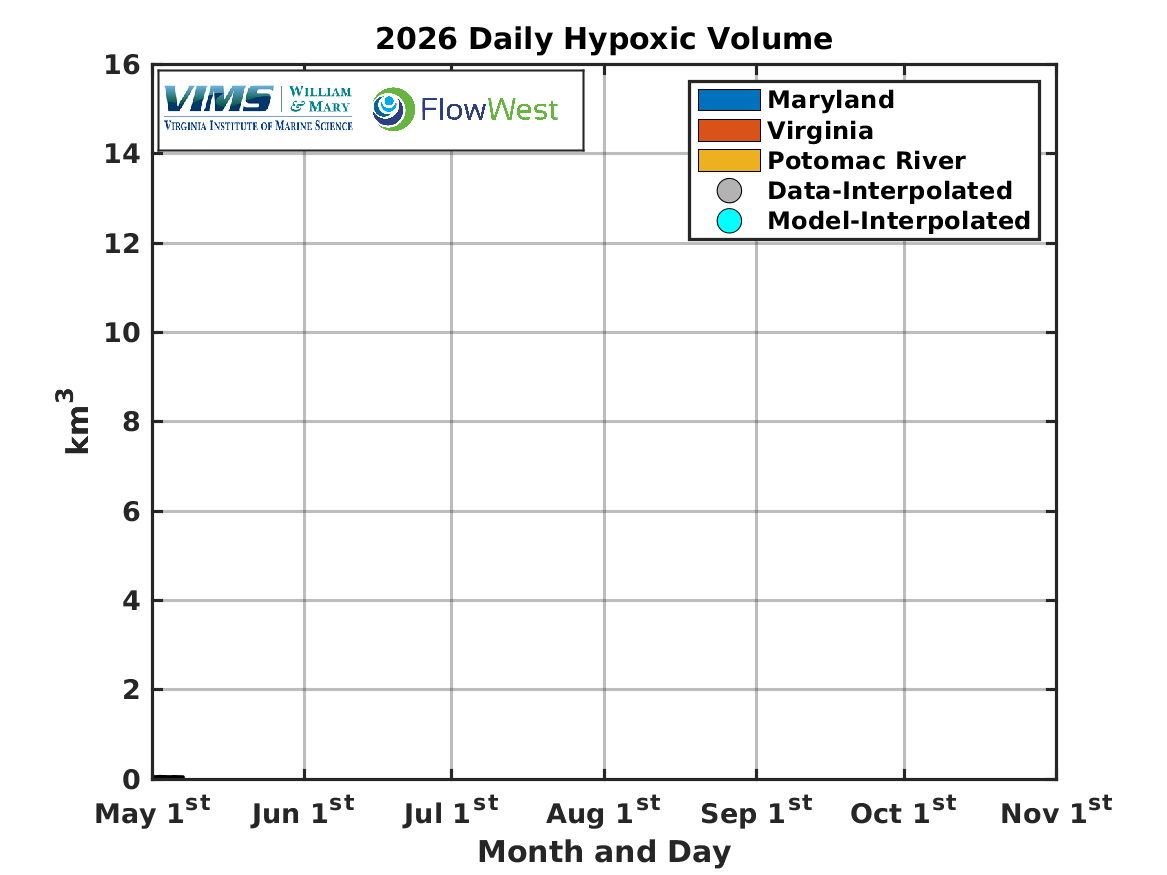
The amount of hypoxia in the Bay is expected to increase from spring into summer and then decrease as summer progresses into fall, with hypoxia starting sometime in May. Check back to see how the size of the dead zone increases seasonally and how daily weather changes the amount of hypoxia. Notable weather that may impact the amount of hypoxia are very windy days or periods of very calm wind. The image below will be continually updated throughout 2026 based on the daily forecast model.
Hypoxia began in May and rose steadily until early July when the peak in summer hypoxia occurred. The amount of hypoxia in the Bay has steadily declined since the peak in July. As of early August both the model-based and data-based estimates of hypoxia are point toward a relatively mild year for deep-water hypoxia in the Bay, similar to the seasonal forecast released in the spring that was based on total nutrient loads to the Bay.
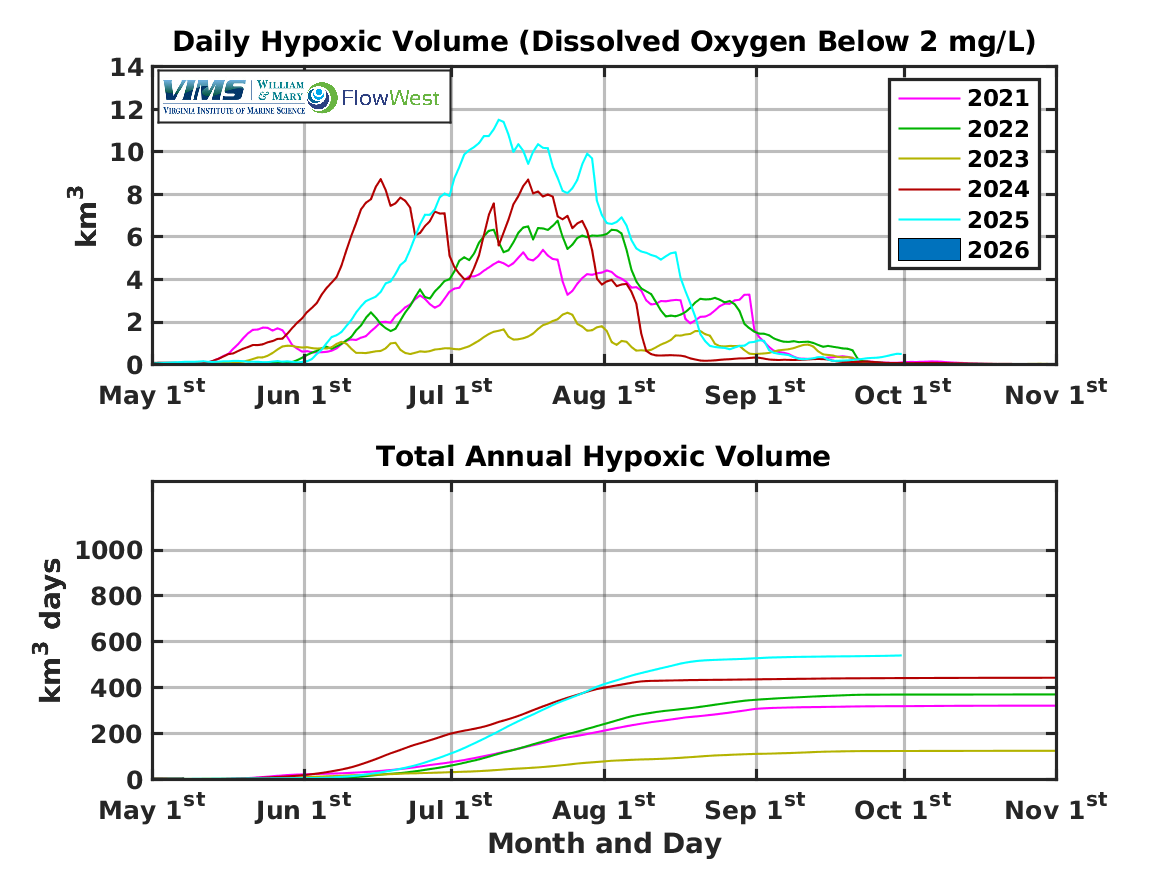
Hypoxic Volume (HV) Metrics for Recent Years for Comparison to 2026 Forecast
| Year | Maximum Daily HV [km3] | Average Summer HV [km3] | Hypoxic Duration [days] | Total Annual HV [km3 days] |
|---|---|---|---|---|
| Historical | 5.6 to 15.8 | 2.4 to 7.8 | 78 to 116 | 317 to 1,015 |
| 2021 | 11.2 (14%) | 5.7 (7%) | 114 | 804 ± 105 |
| 2022 | 13.1 (16%) | 6.4 (8%) | 96 | 797 ± 104 |
| 2023 | 6.5 (8%) | 3.5 (4%) | 116 | 497 ± 65 |
| 2024 | 16.1 (20%) | 6.5 (8%) | 85 | 881 ± 115 |
| 2025 | 13.7 (17%) | 5.7 (7%) | 76 | 718 ± 93 |
Notes: 1 km3 equals about 400,000 Olympic-sized swimming pools of water. Percents (%) represent the percent of the Bay that was hypoxic based on the volume of the Bay and tidal tributaries in the forecast model. Historical values are based on a 39-year simulation and represent the normal range in conditions between 1985 to 2024 (median ± one standard deviation).
- Maximum Daily Hypoxic Volume (km3): The maximum volume of Chesapeake Bay water experiencing hypoxic conditions on any given day
- Average Summer Hypoxic Volume (km3): The average volume of hypoxic water from June through September
- Hypoxic Duration (days): The number of days in a given year between the first and last day of hypoxic conditions exceeding 2 km3 in volume
- Total Annual Hypoxic Volume (km3 days): The total amount of hypoxia in the Bay for a given year, calculated by summing the hypoxic volume on each day. Uncertainty in total annual hypoxic volume estimates from cruise-based observed data has been estimated at 13% (Bever et al. 2018, Table 4). The 13% was adopted here as a general estimate of the uncertainty of the total annual hypoxic volume for each year, represented by the plus and minus (±) value.
Historical Hypoxic VolumesThe table below provides yearly metrics of model-estimated hypoxic volumes and the duration of hypoxia from 1985 through 2024. These metrics of hypoxia were derived using daily hypoxic volumes from long model simulations. The daily hypoxic volume and total annual hypoxic volume were calculated from the daily-averaged 3D model output following Bever et al. (2018). The duration of hypoxia was calculated from the daily estimates of hypoxic volume following Bever et al. (2013). The average summer hypoxic volume is the average volume of hypoxic water on each day from June through September. These yearly metrics of the severity of hypoxia in Chesapeake Bay are thus based on computer models that continue to be improved; therefore past estimates, such as those in the below table, may be updated as improvements to the model are made.
|
2026 Model-Data Comparison (Model Accuracy)The Maryland Department of Natural Resources and Old Dominion University periodically collect dissolved-oxygen data from the water surface to the seabed as part of the long-term Water Quality Monitoring Program. We use these data to calculate an estimate of the hypoxic volume, which we compare with the hypoxic volume estimated using the model. The data-based and model-based estimates of hypoxic volume will not be the same because different methods are used for each. However, we expect they should be similar and follow a similar seasonal pattern. The image and text below compare the model-based and data-based hypoxic volumes; we periodically update the data-based hypoxic volumes through the summer as more data become available. The black lines above and below the gray dots show the uncertainty in the data-based estimate of hypoxic volume. The blue dots are model-based hypoxic volumes calculated in a similar manner to how the data-based hypoxic volumes are calculated.
|