
Temperature
Forecasts for the Chesapeake Bay
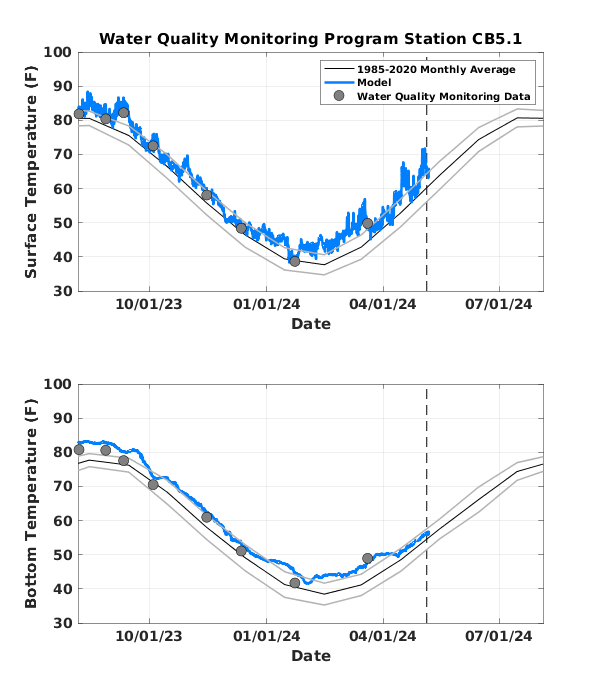
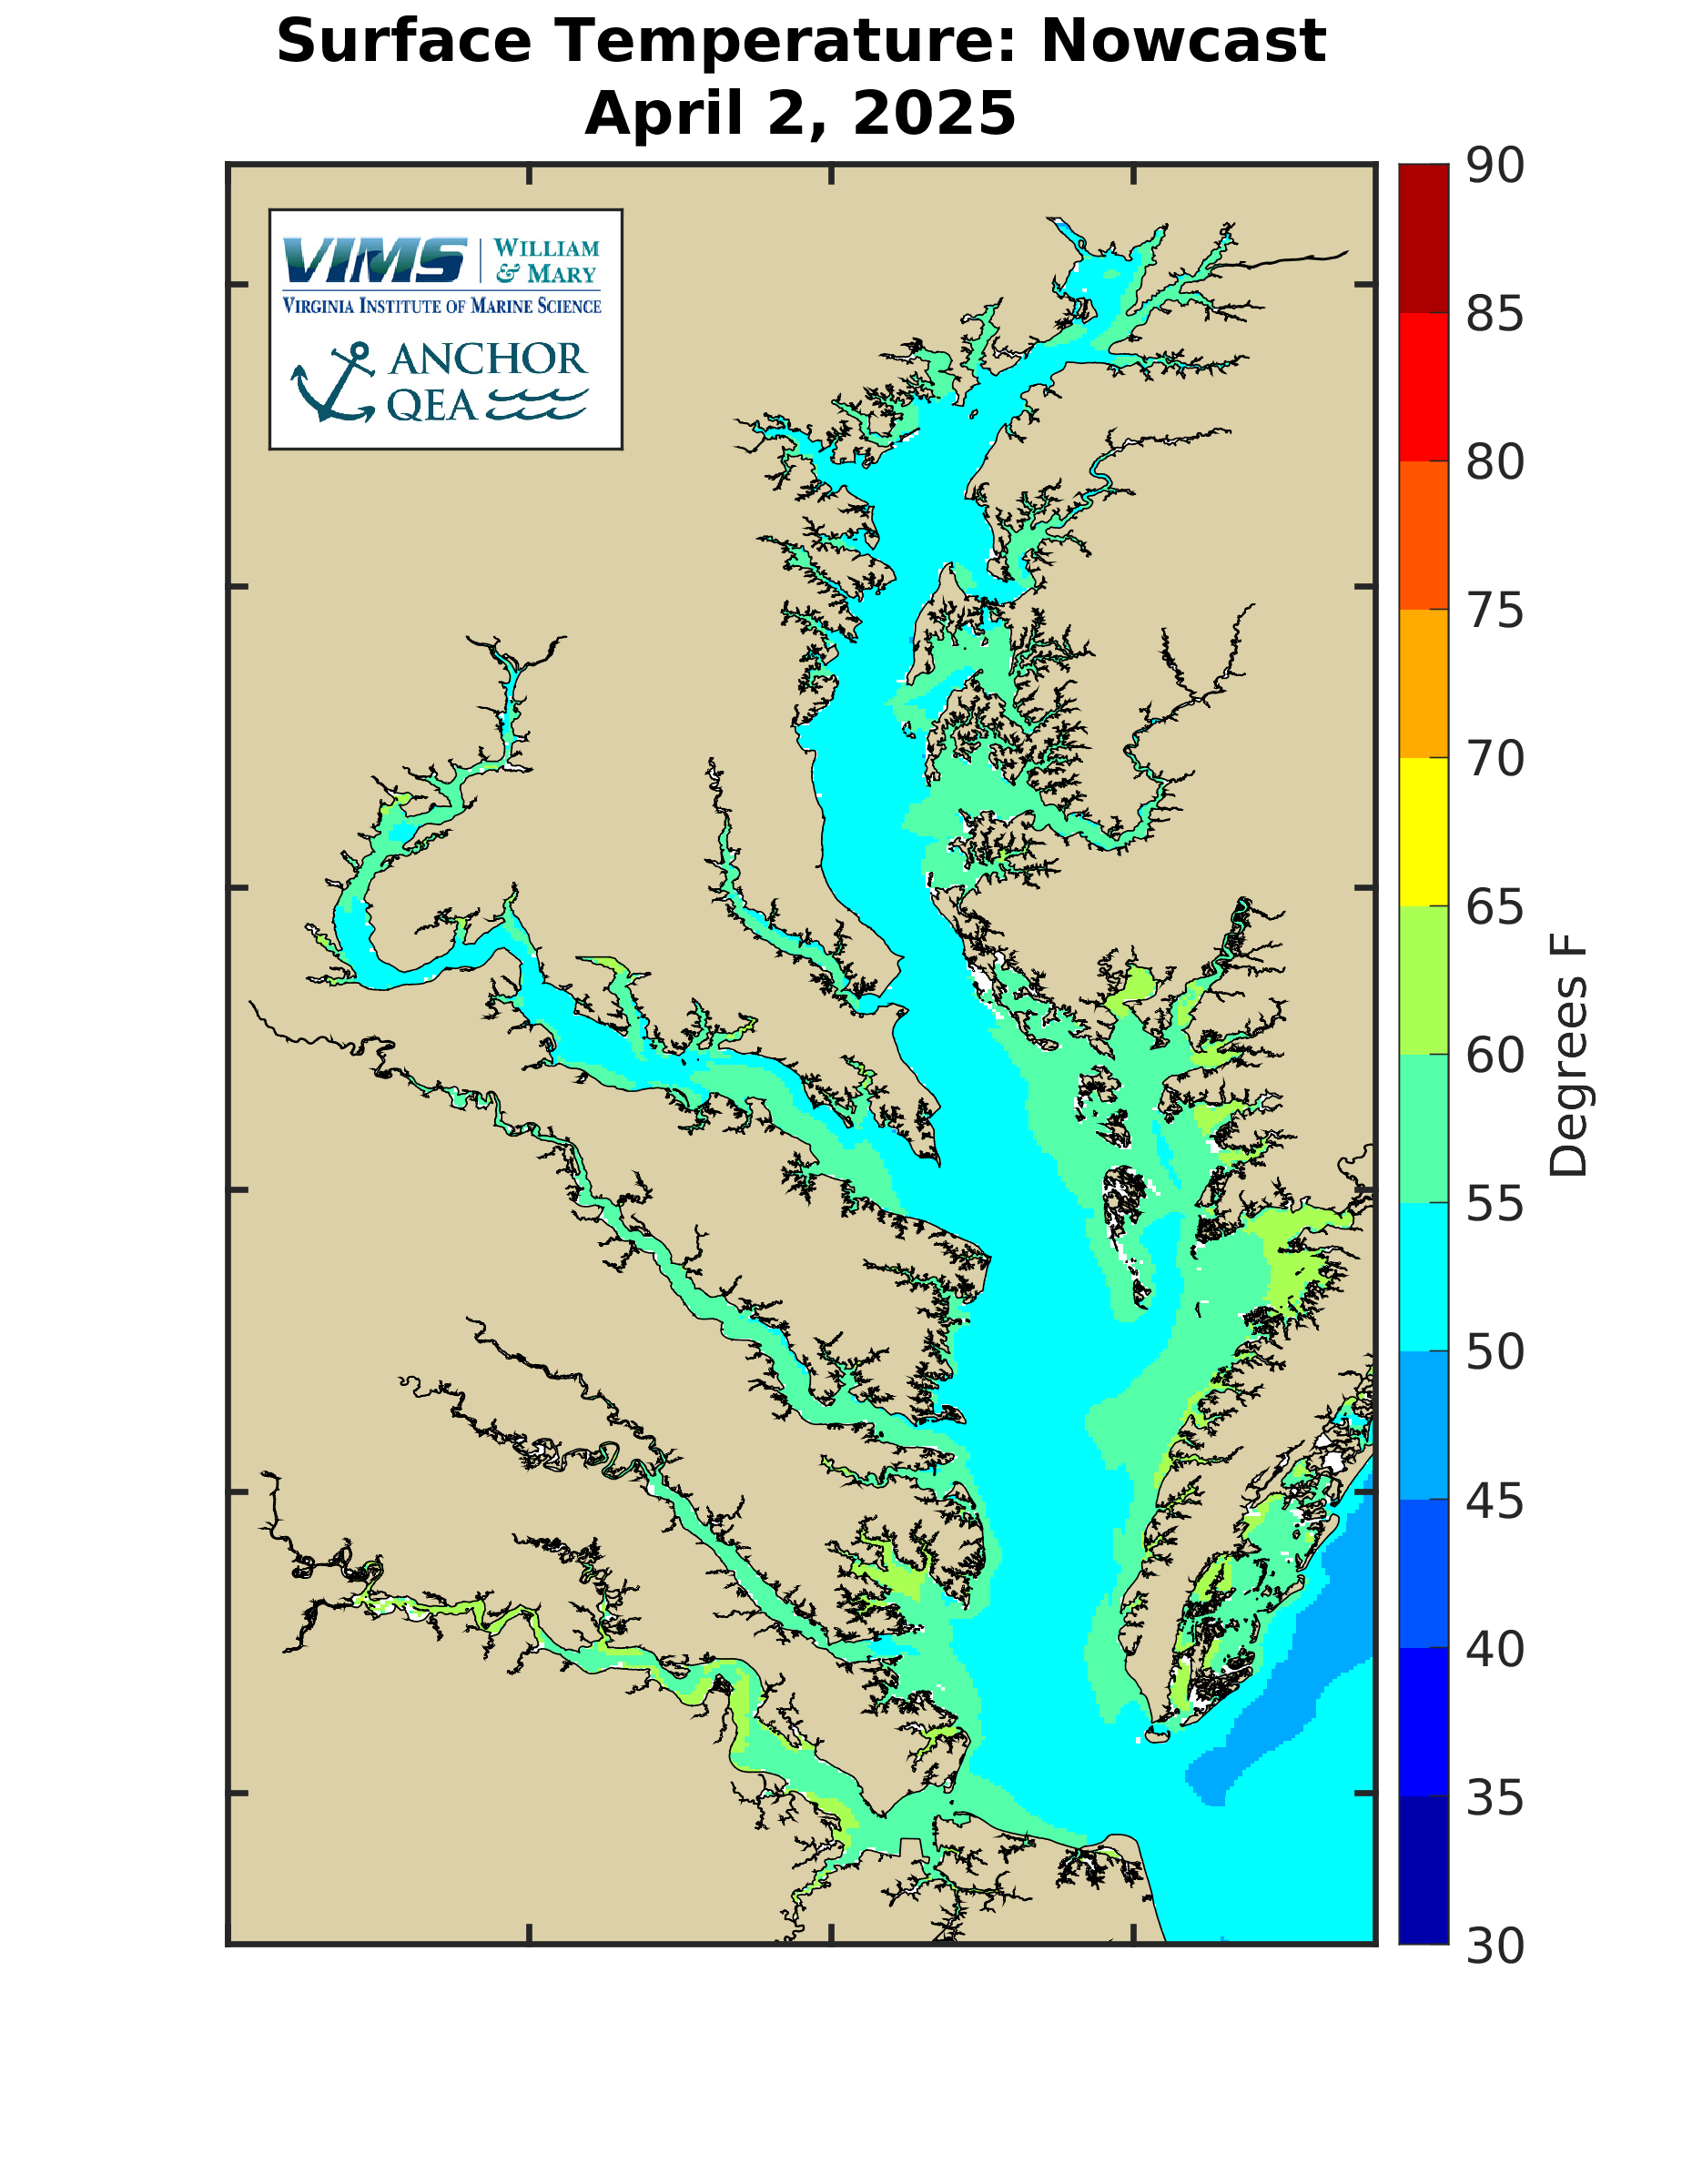
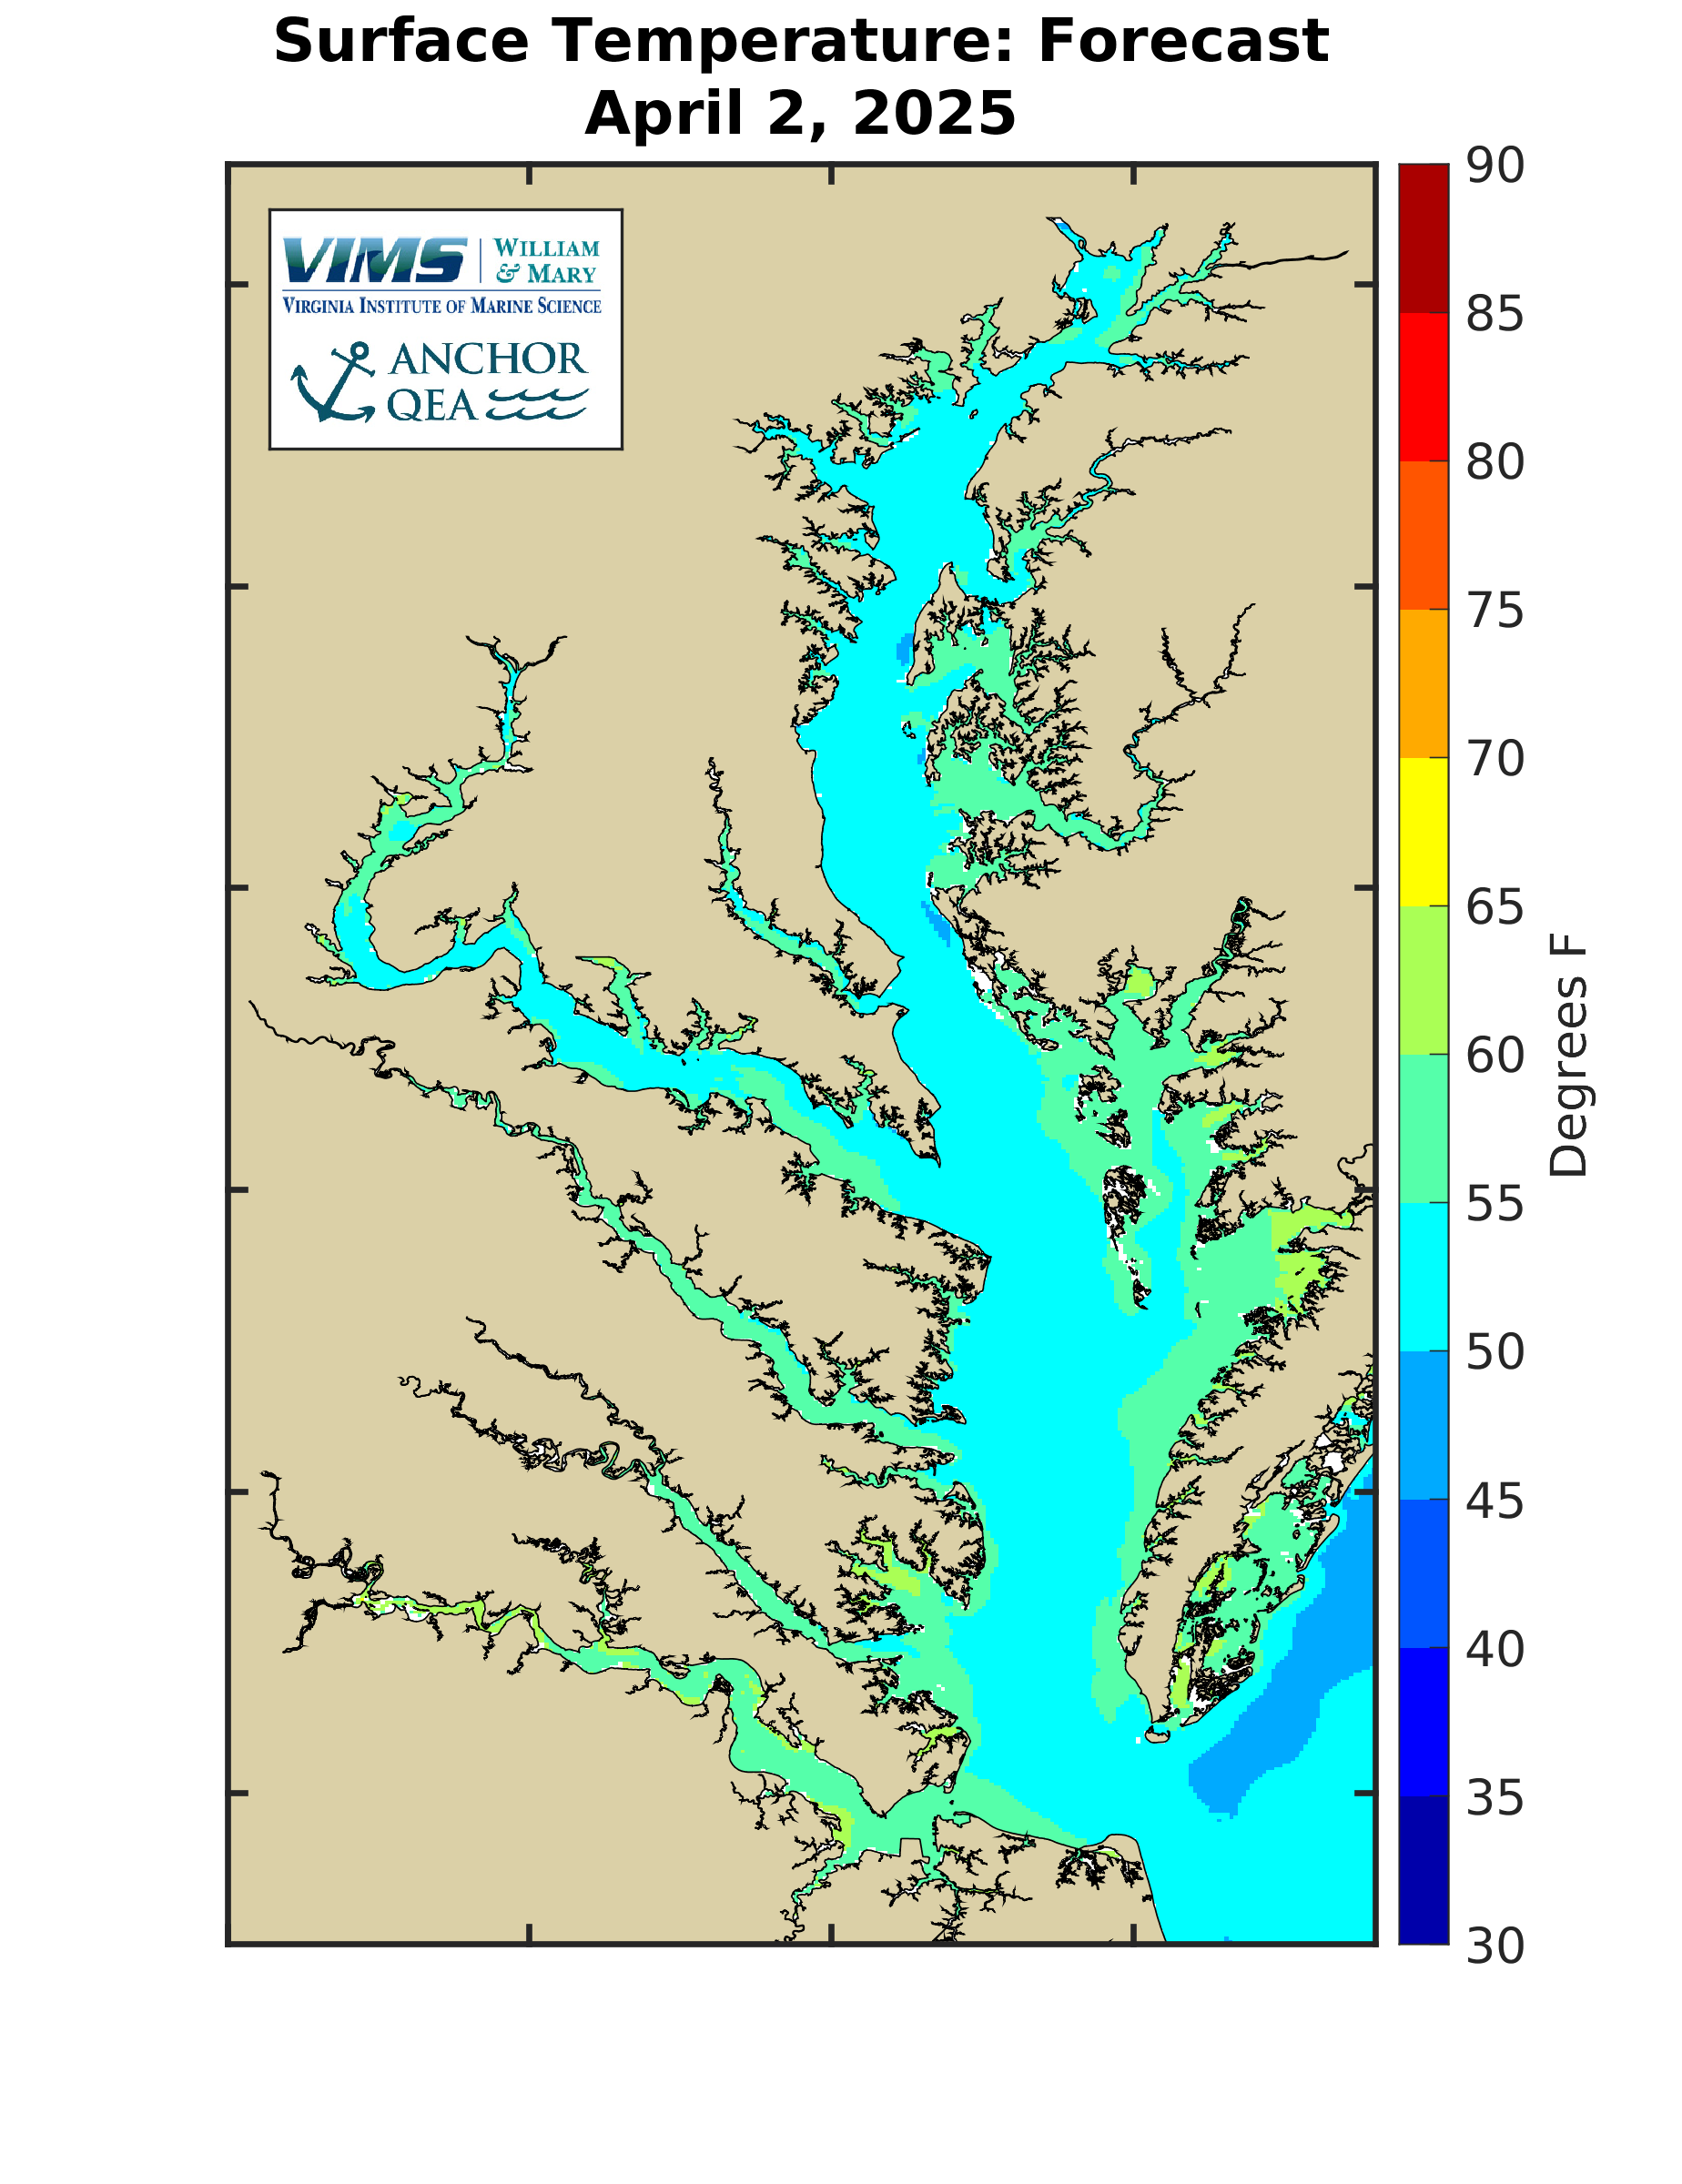
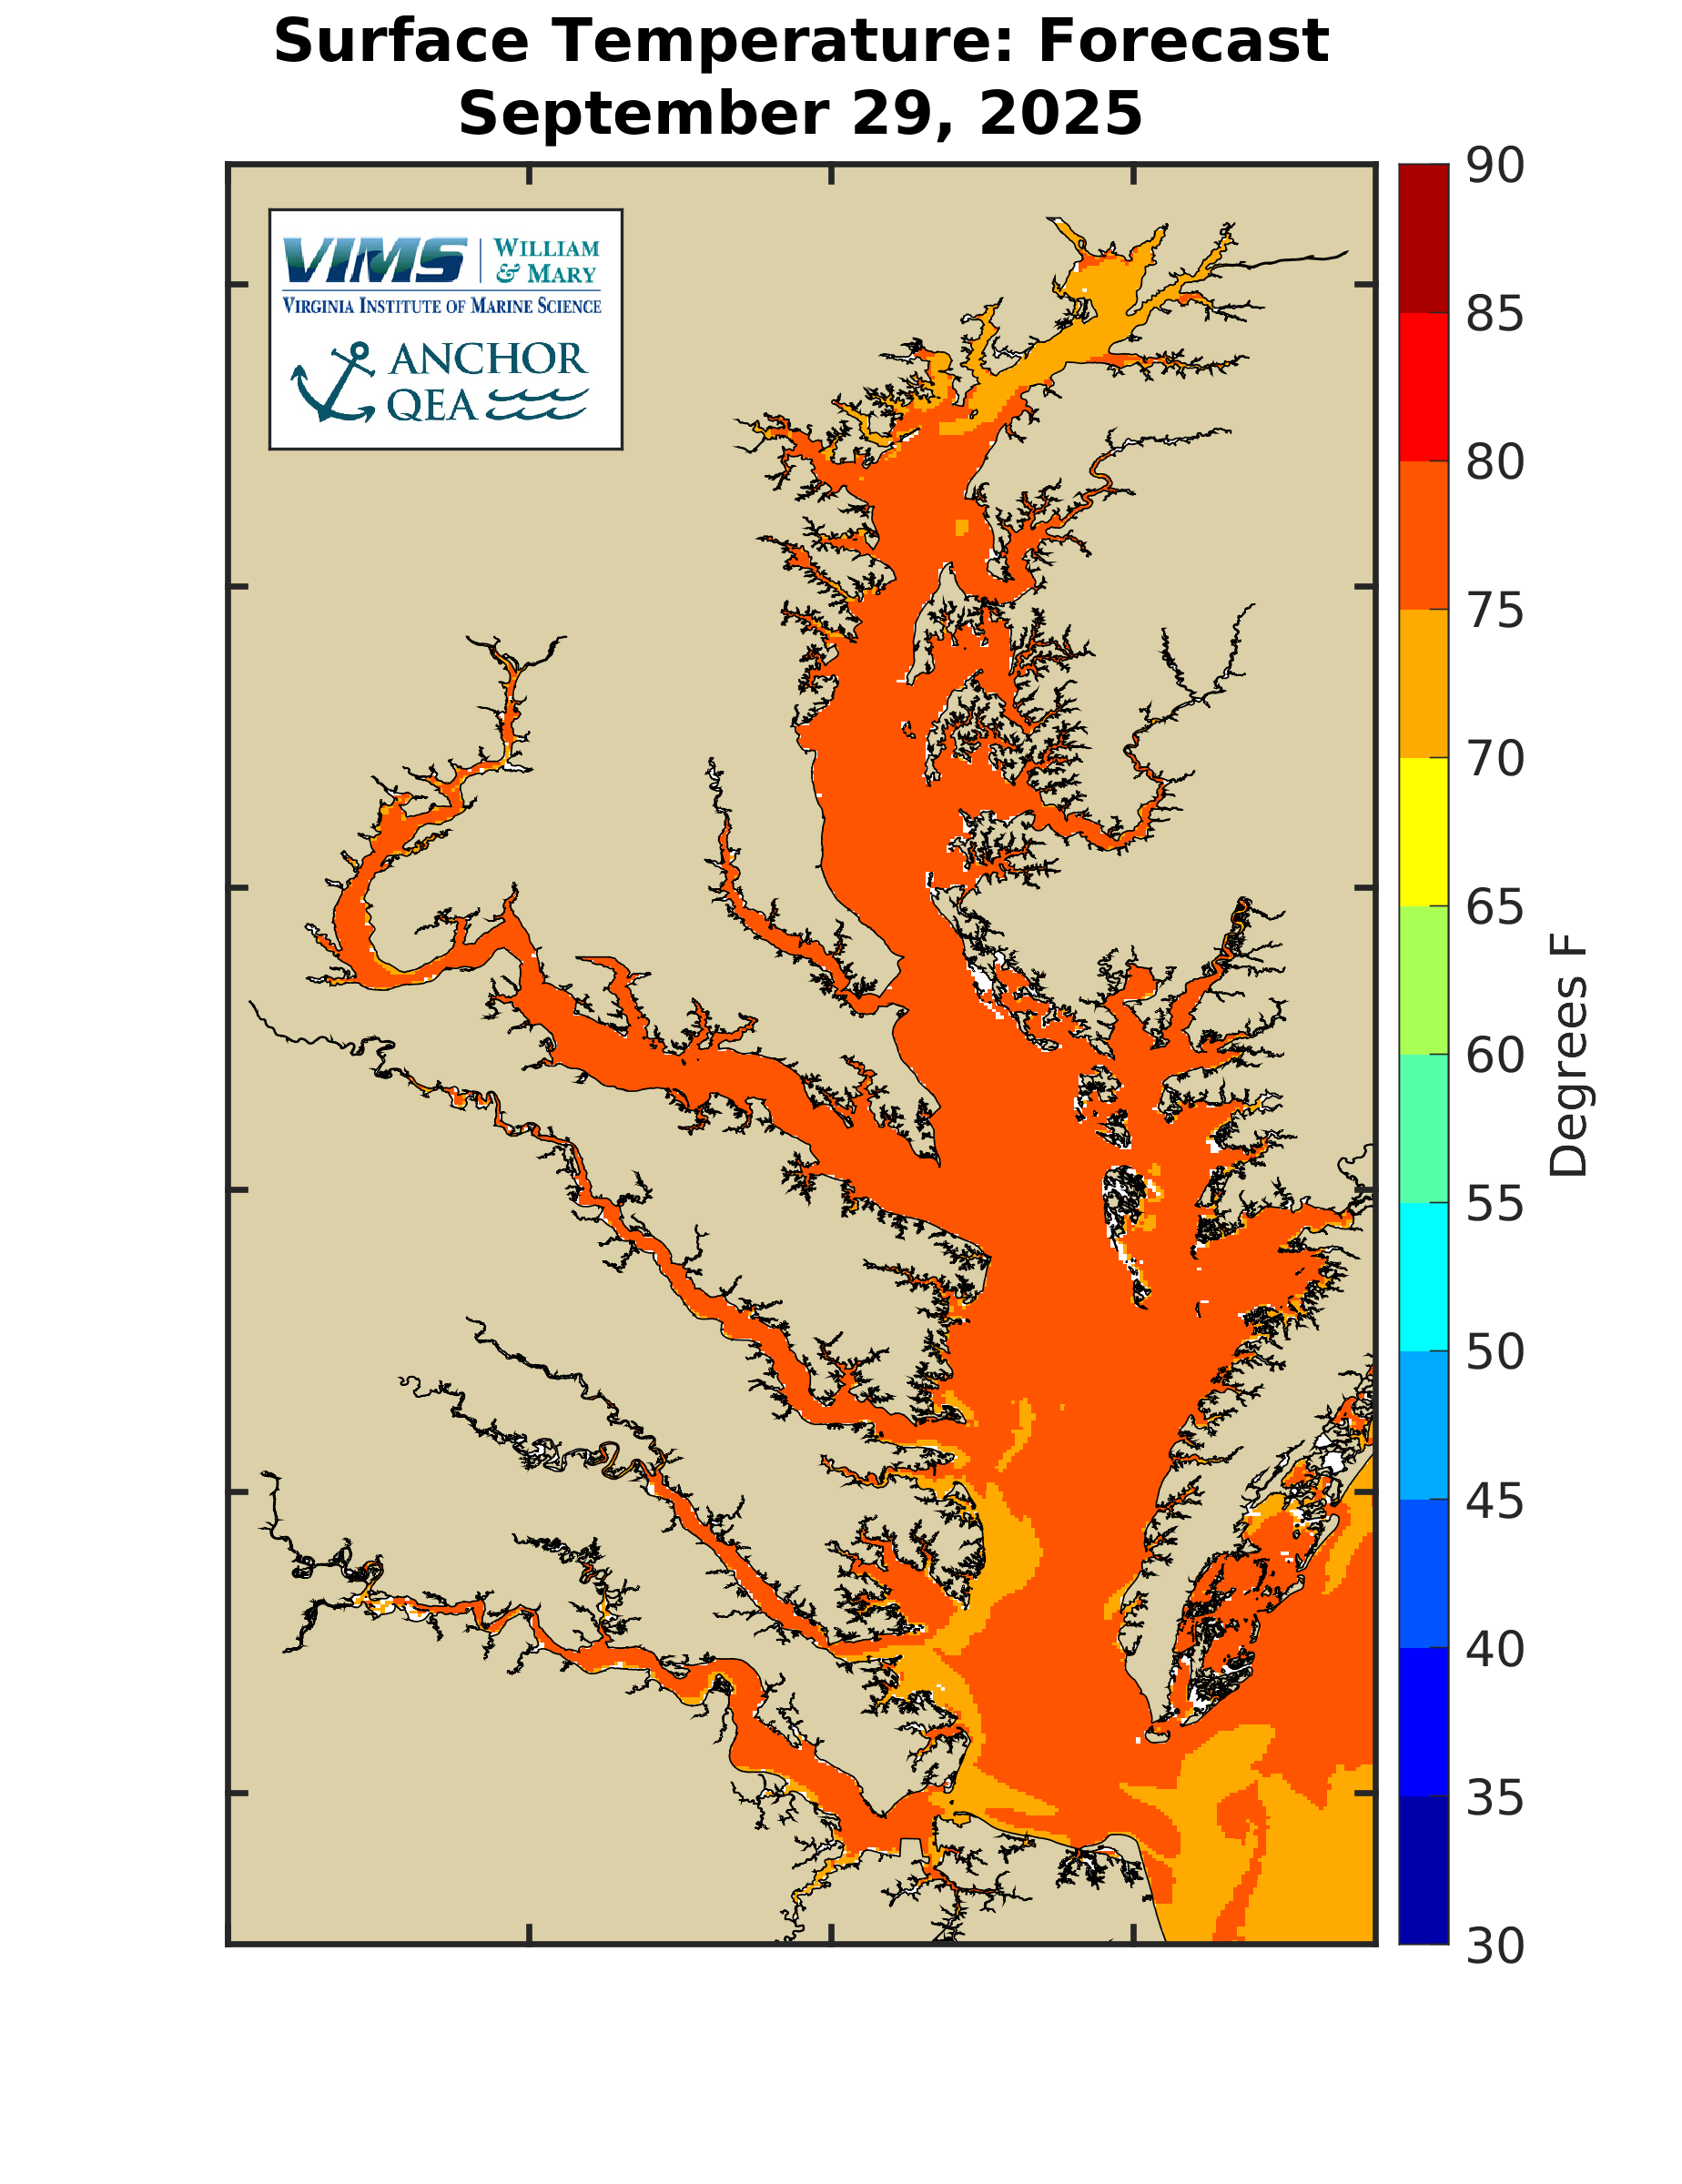
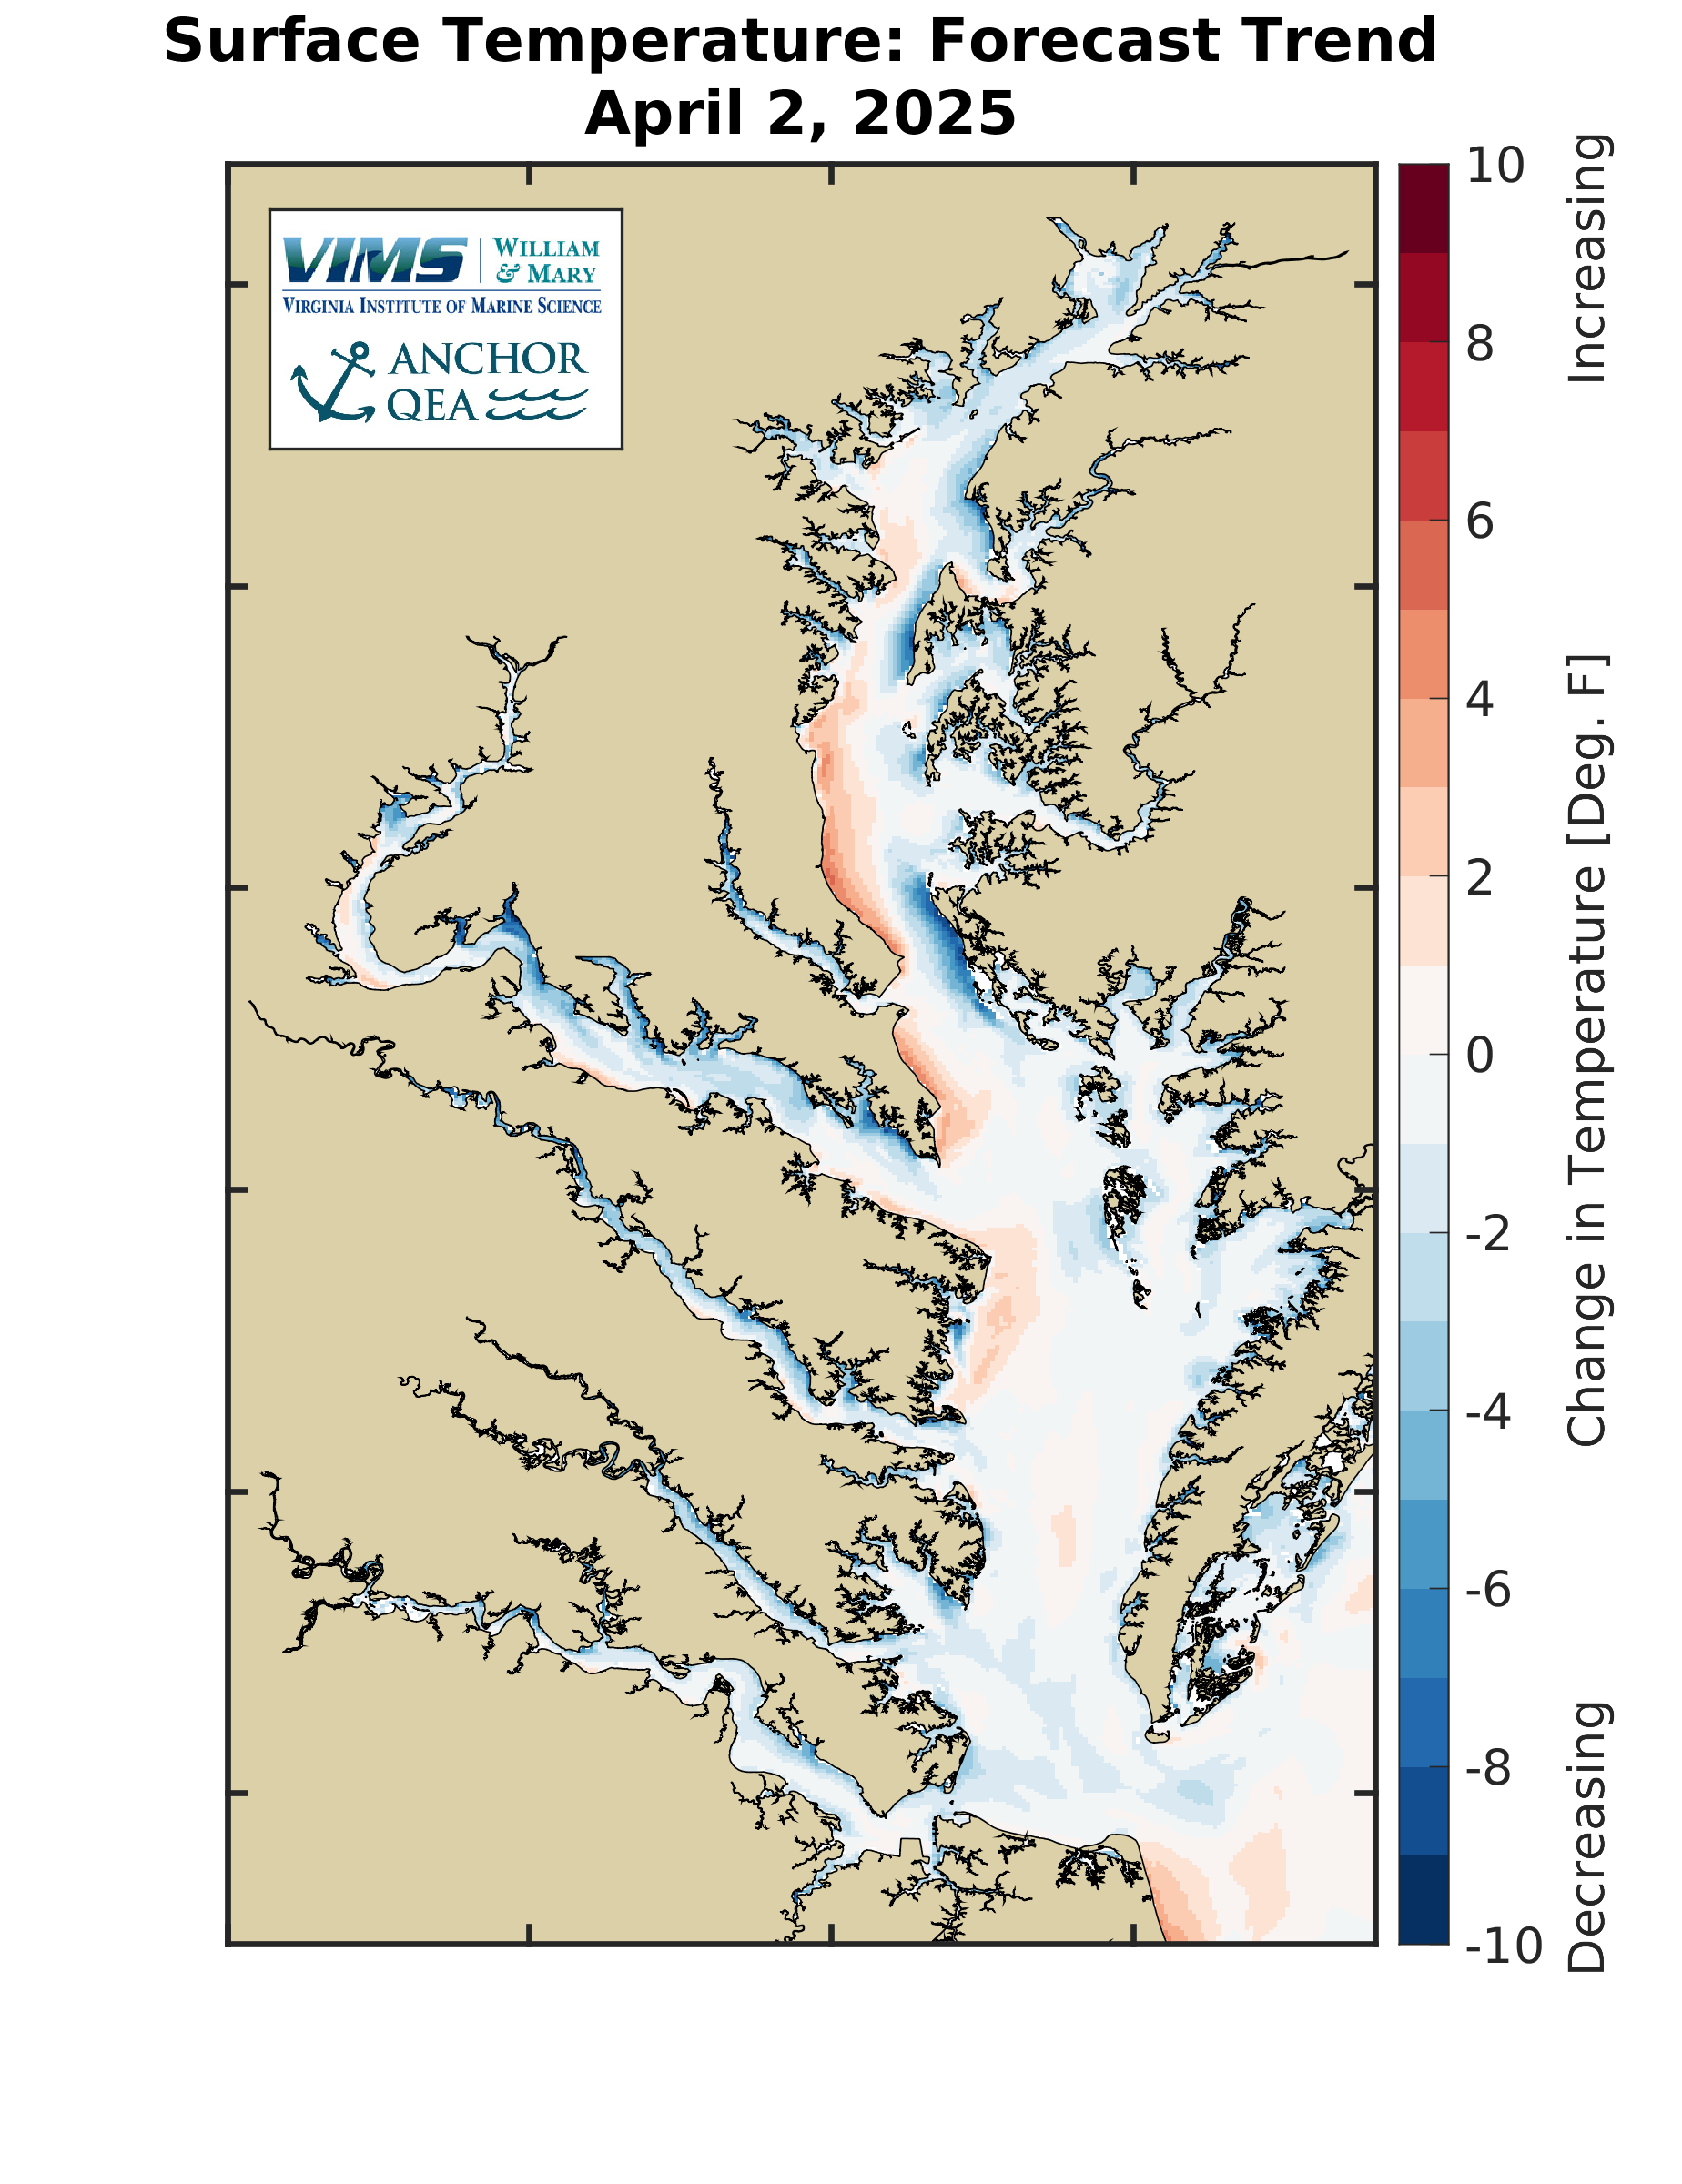
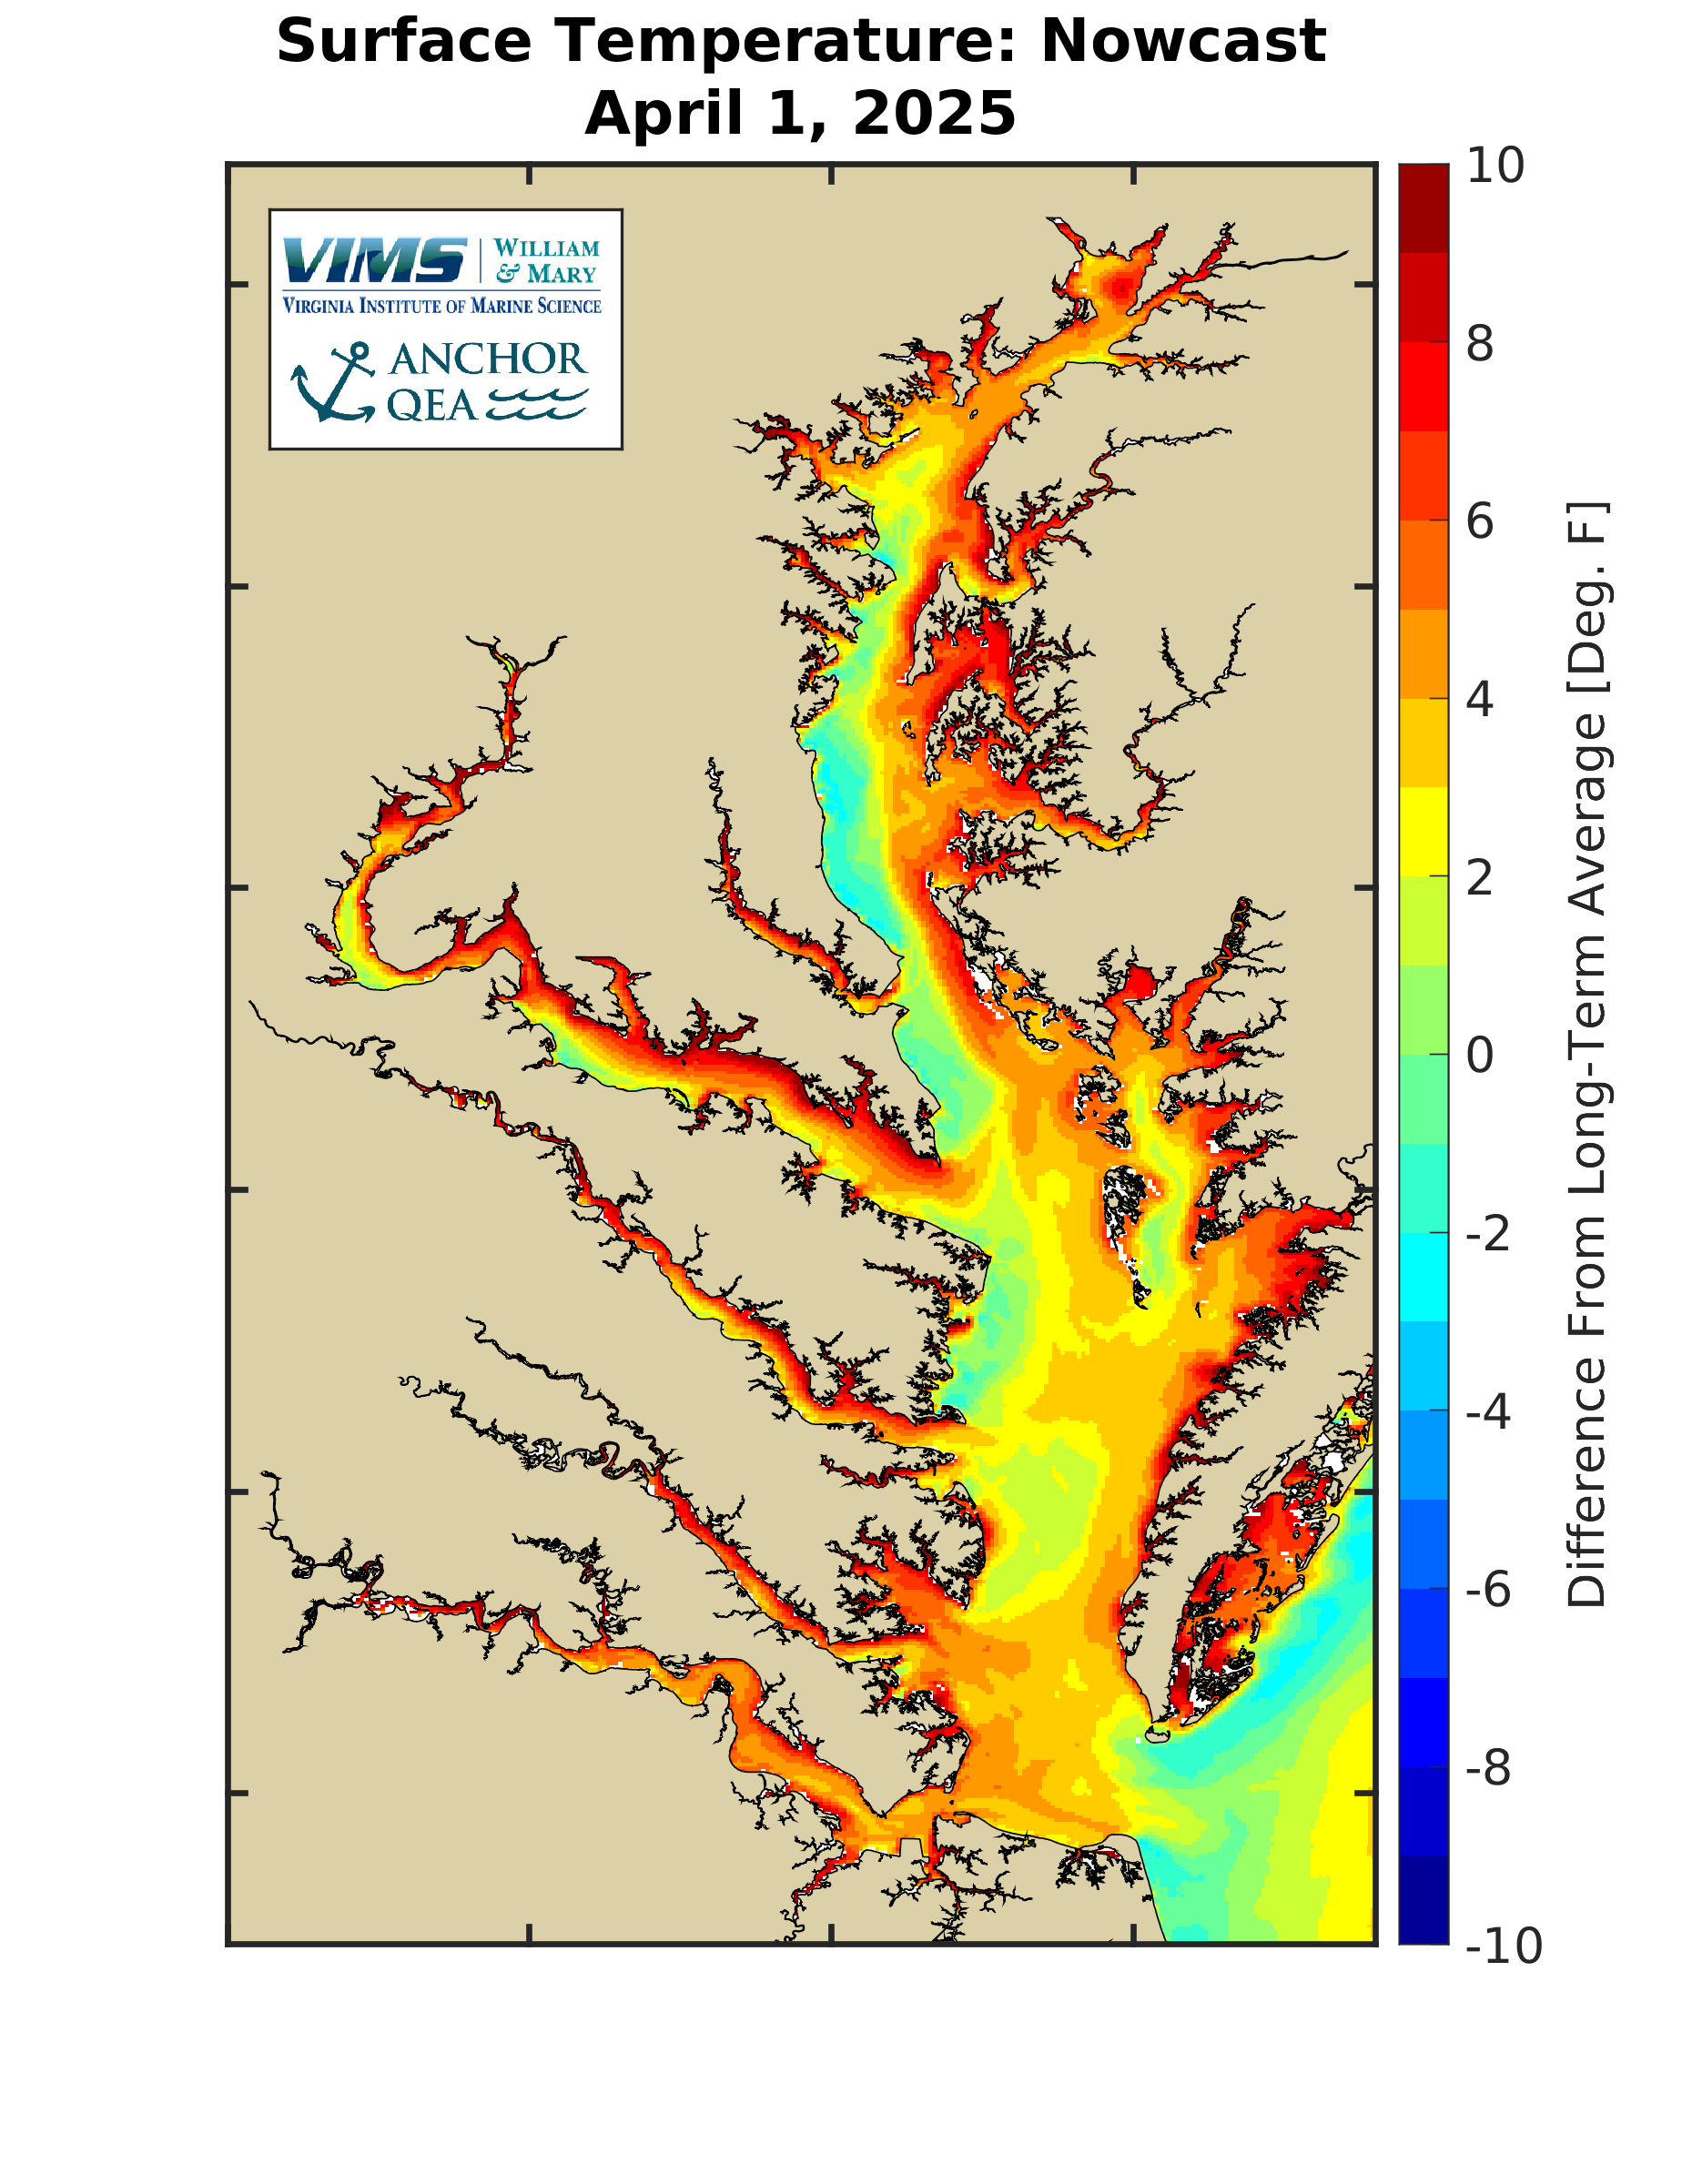
Surface Temperature Maps
Difference From Long-Term Average
Current conditions are compared to the long-term average conditions to put current conditions in perspective relative to average conditions. Long-term average conditions were calculated using a computer model simulation spanning 1985 through 2022. The below map shows the difference between current conditions and the long-term average conditions on the day noted. For more information on the long-term averages please see the Chesapeake Atlas.
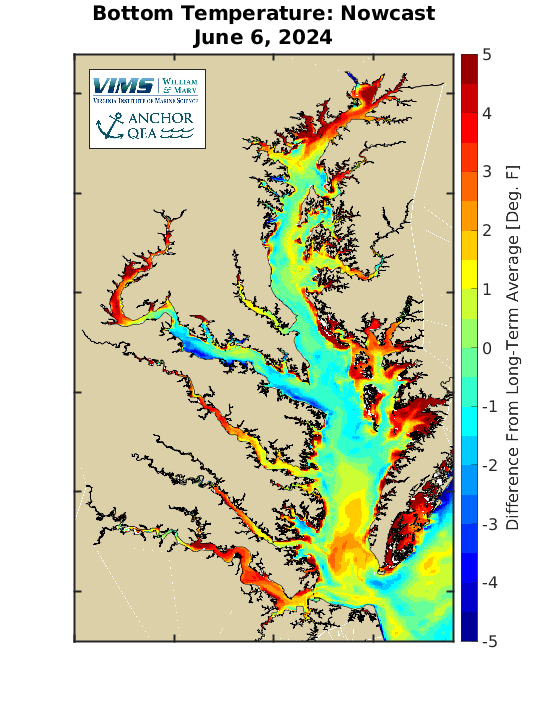
Bottom Temperature Maps
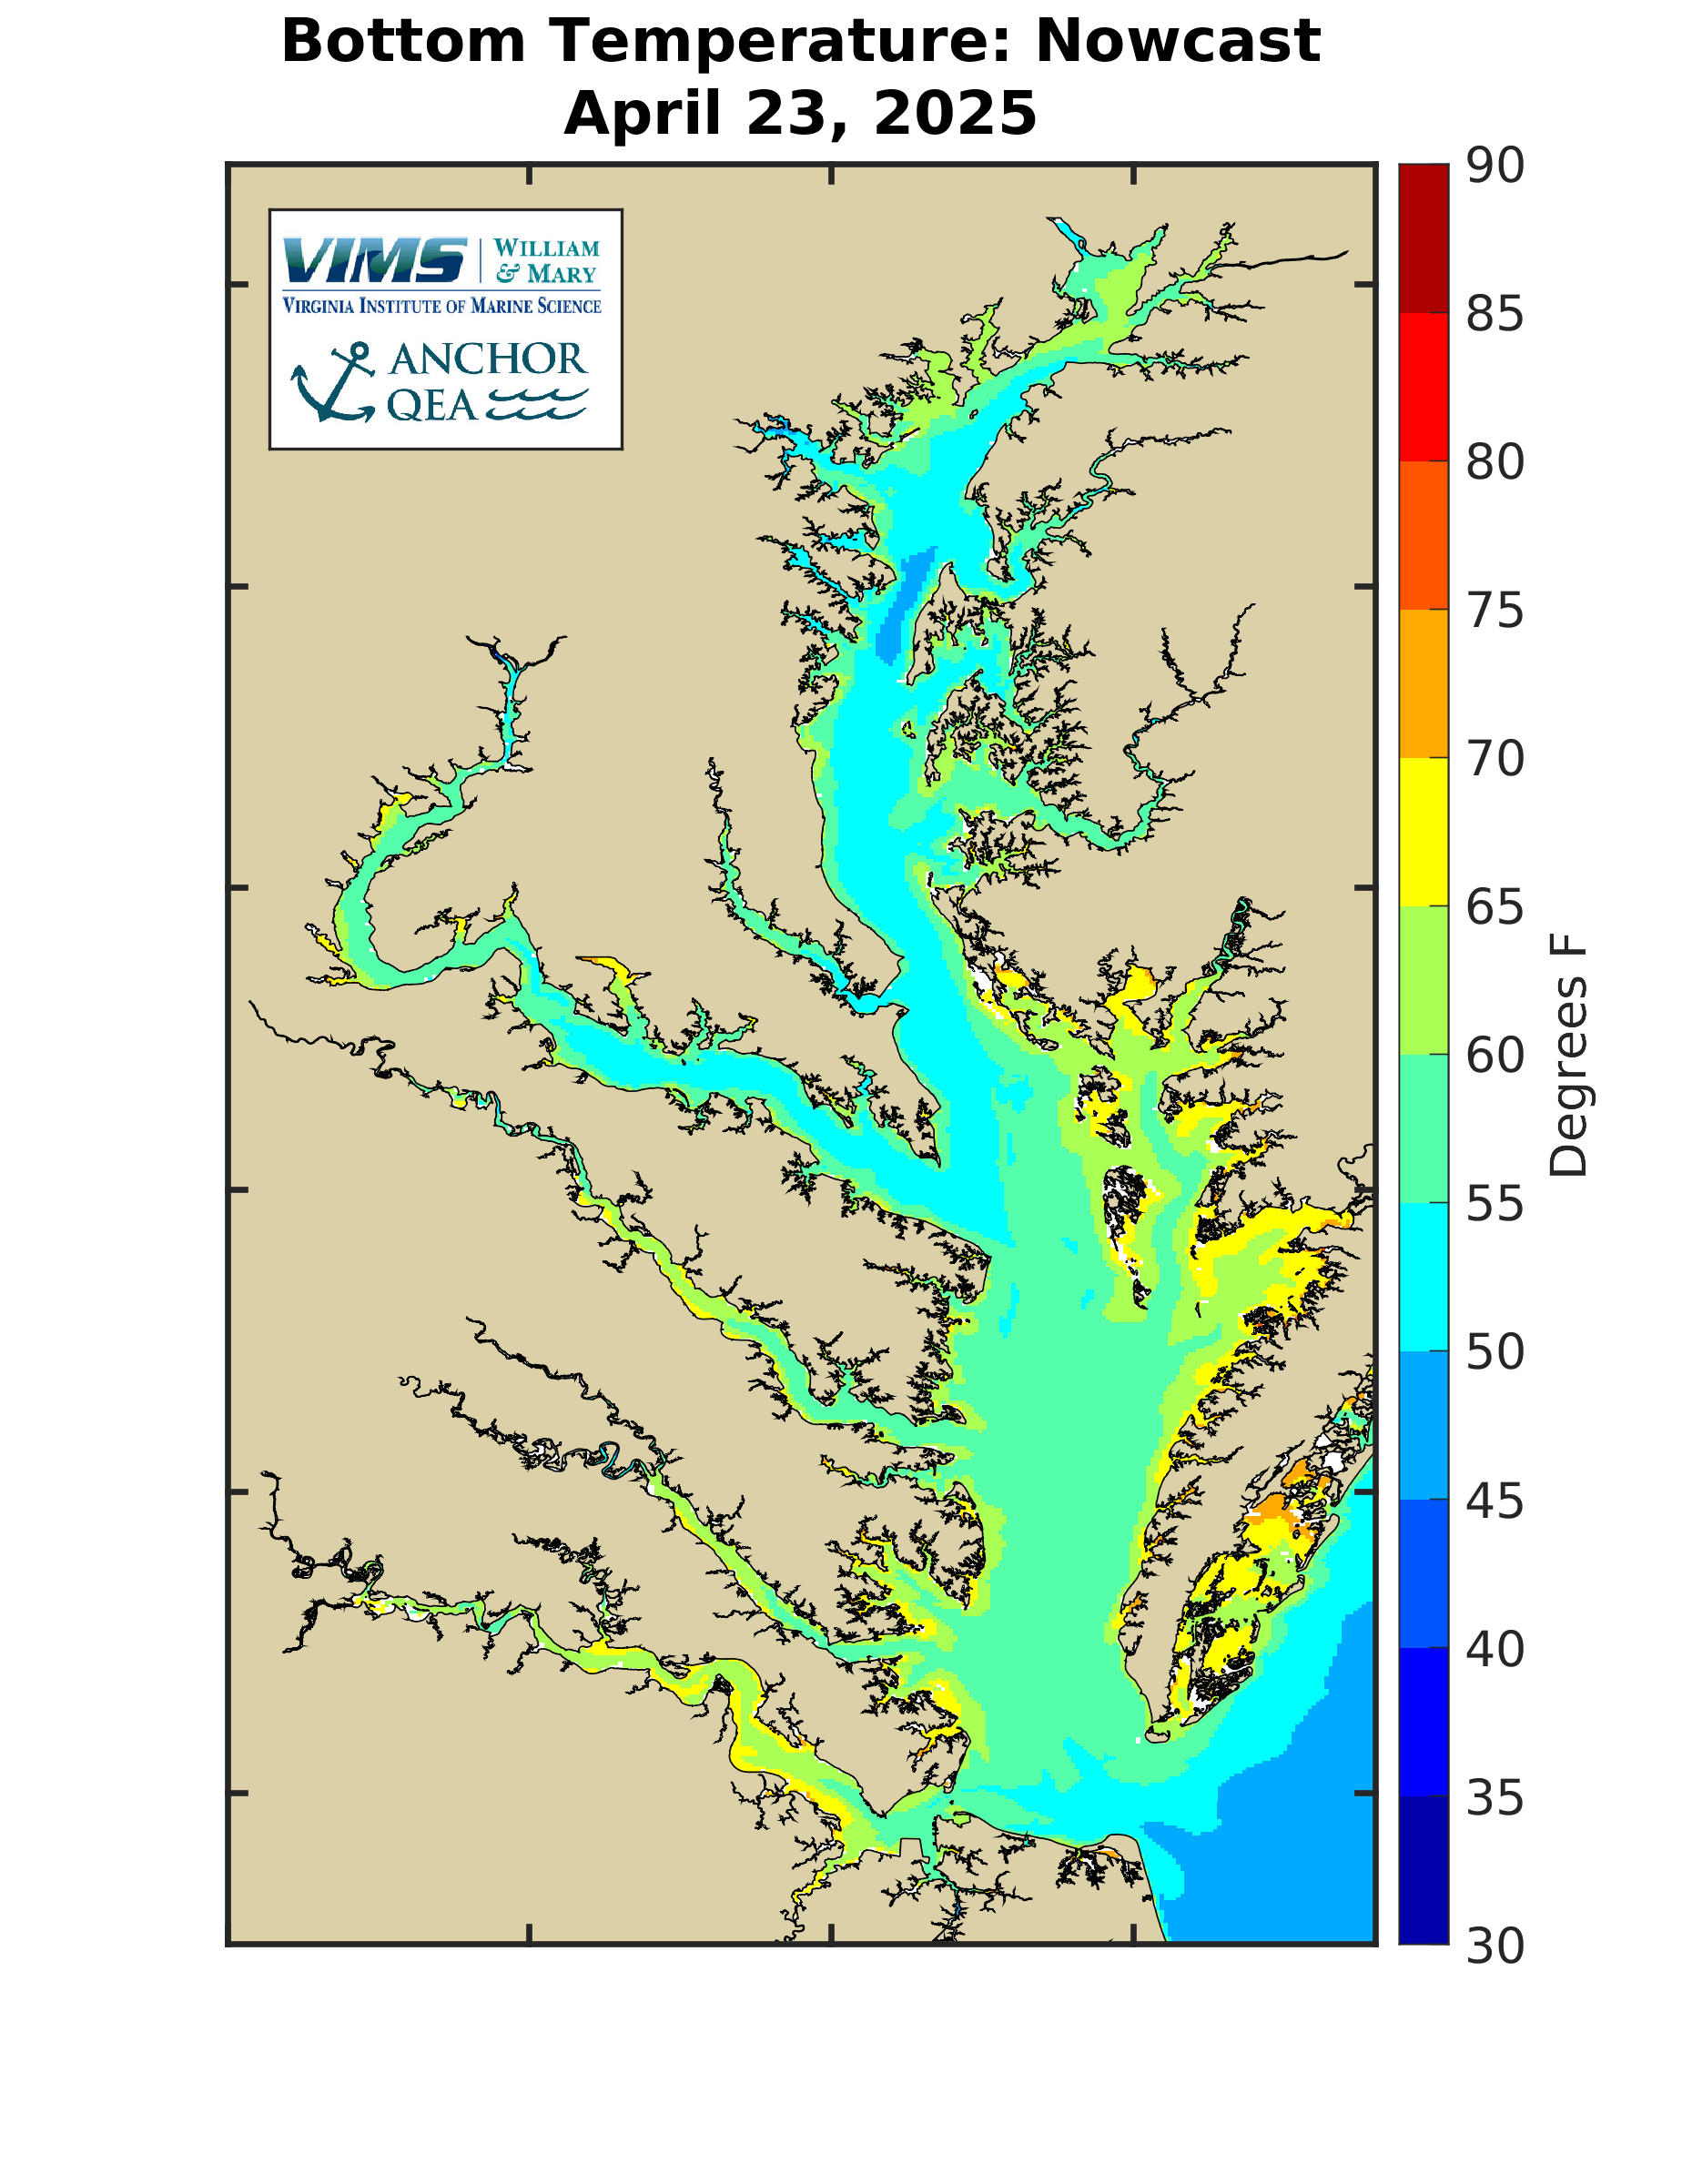
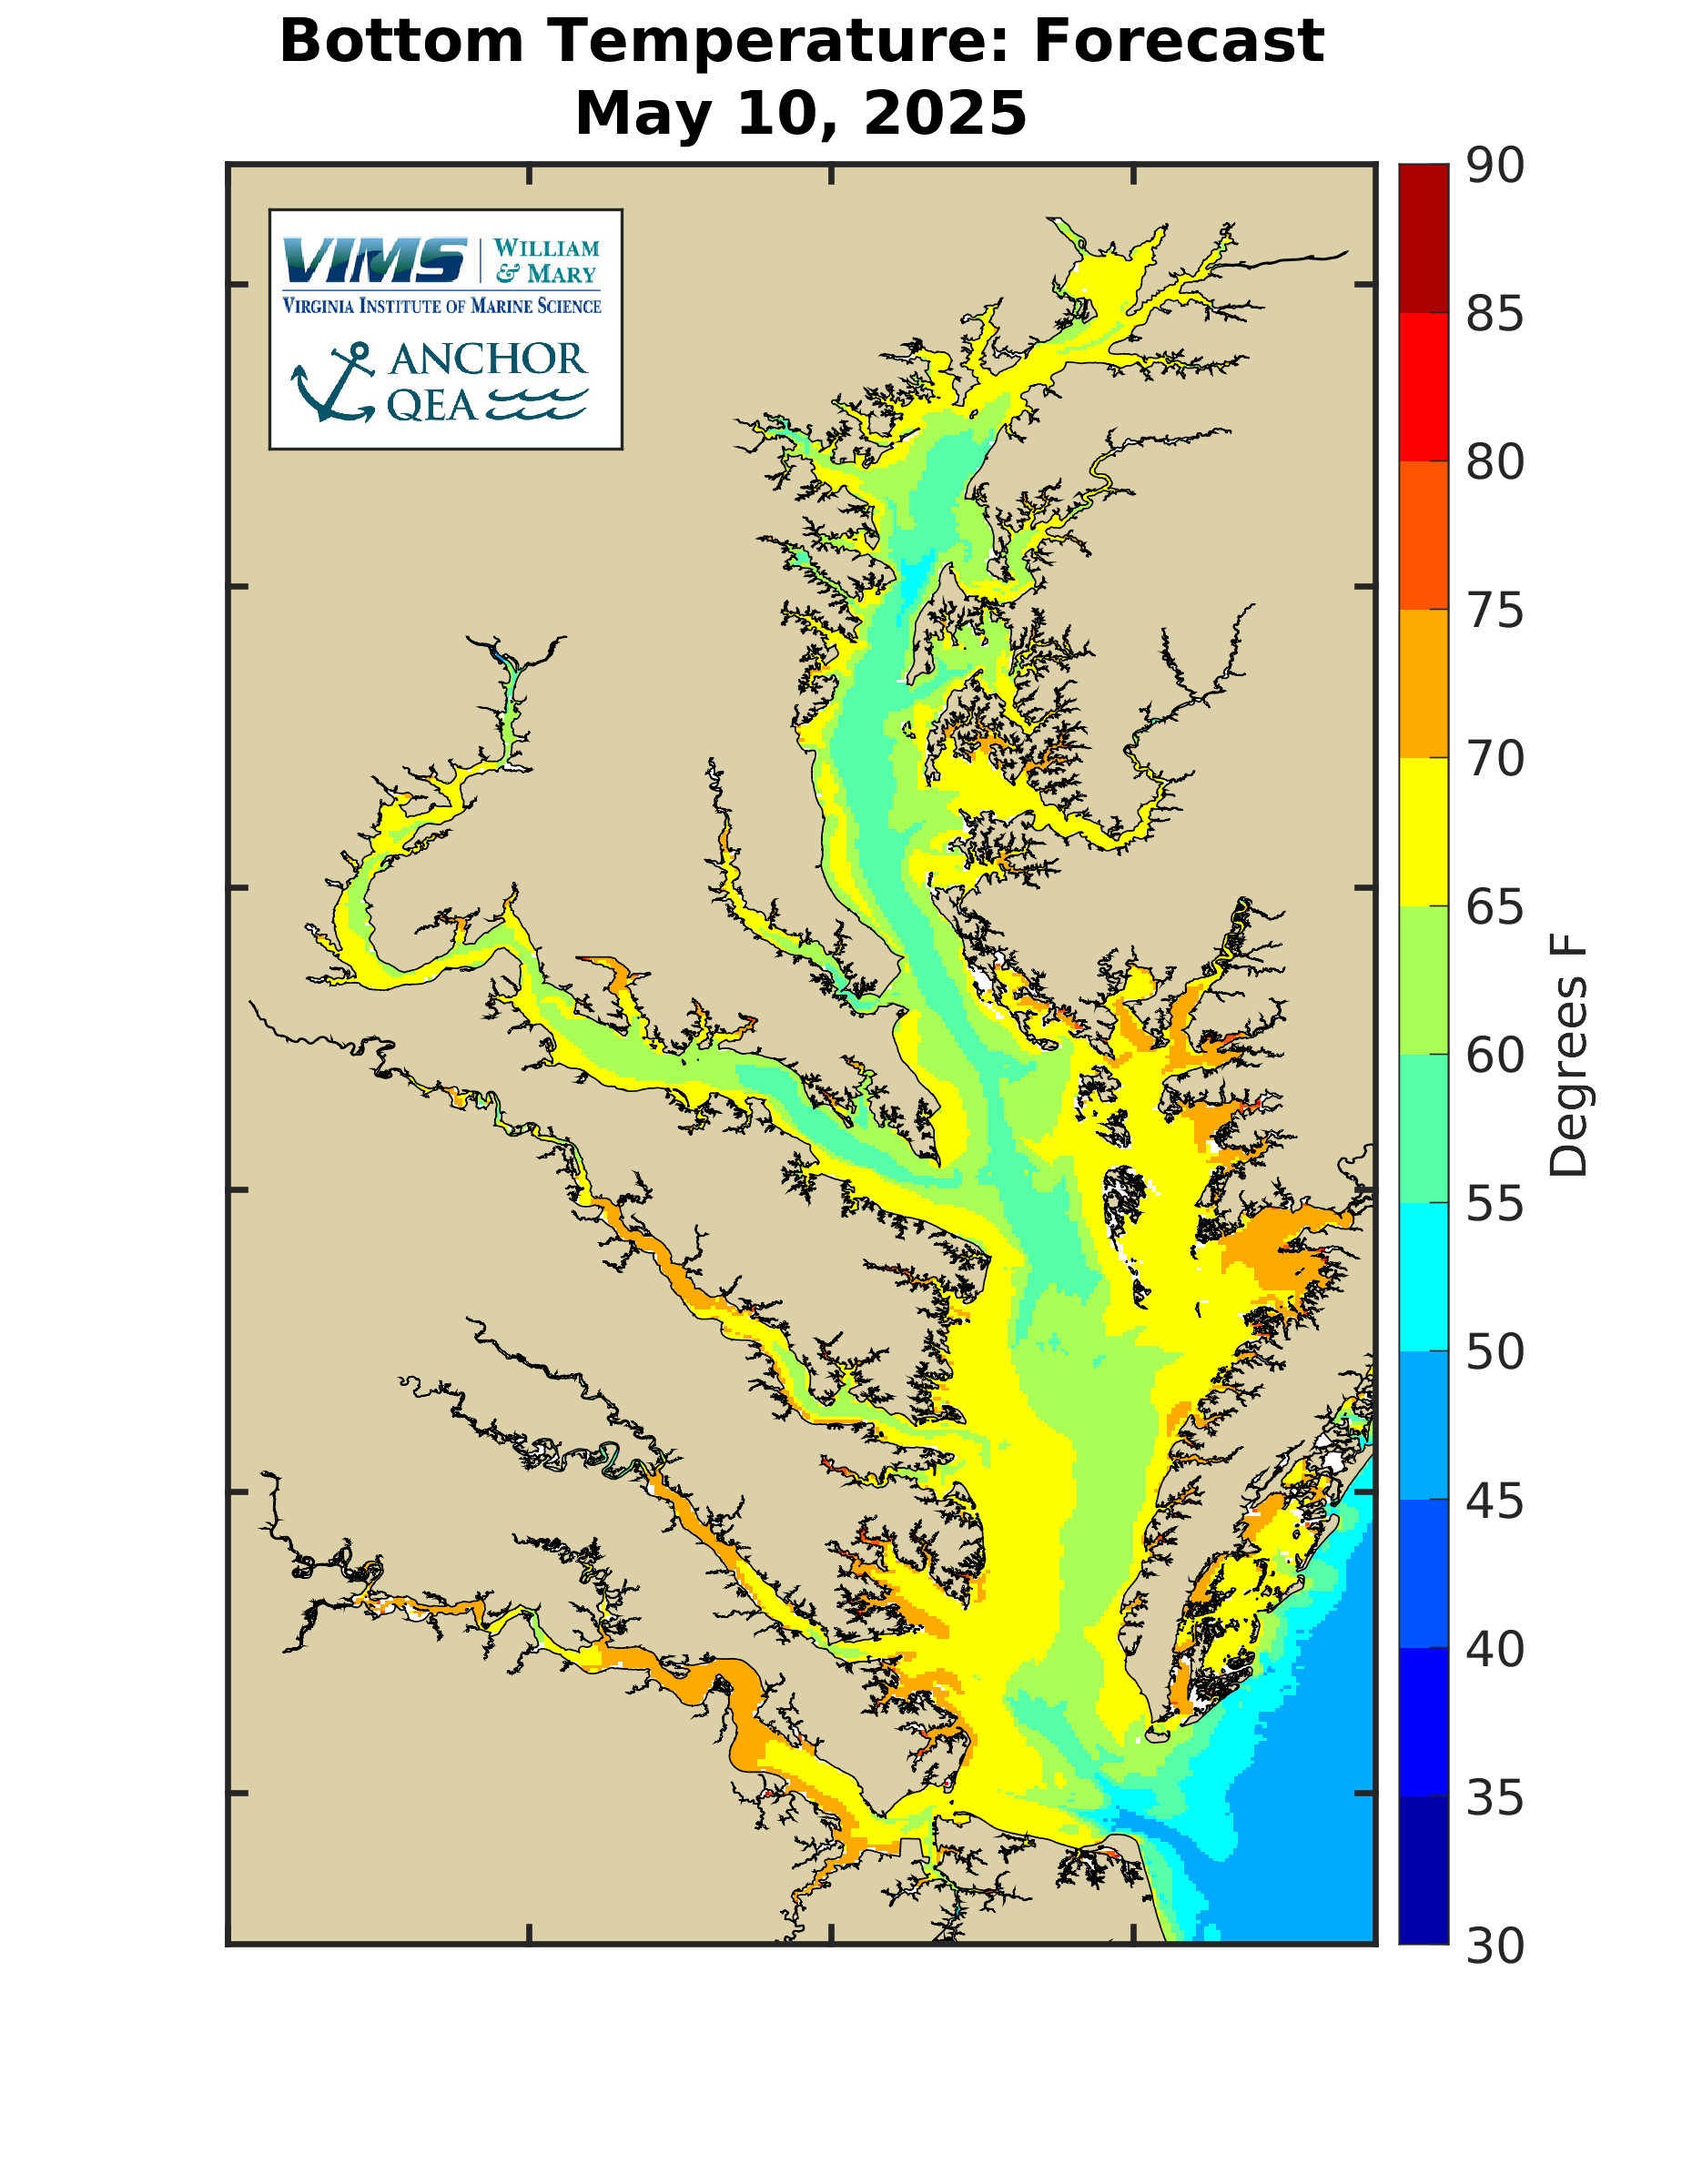
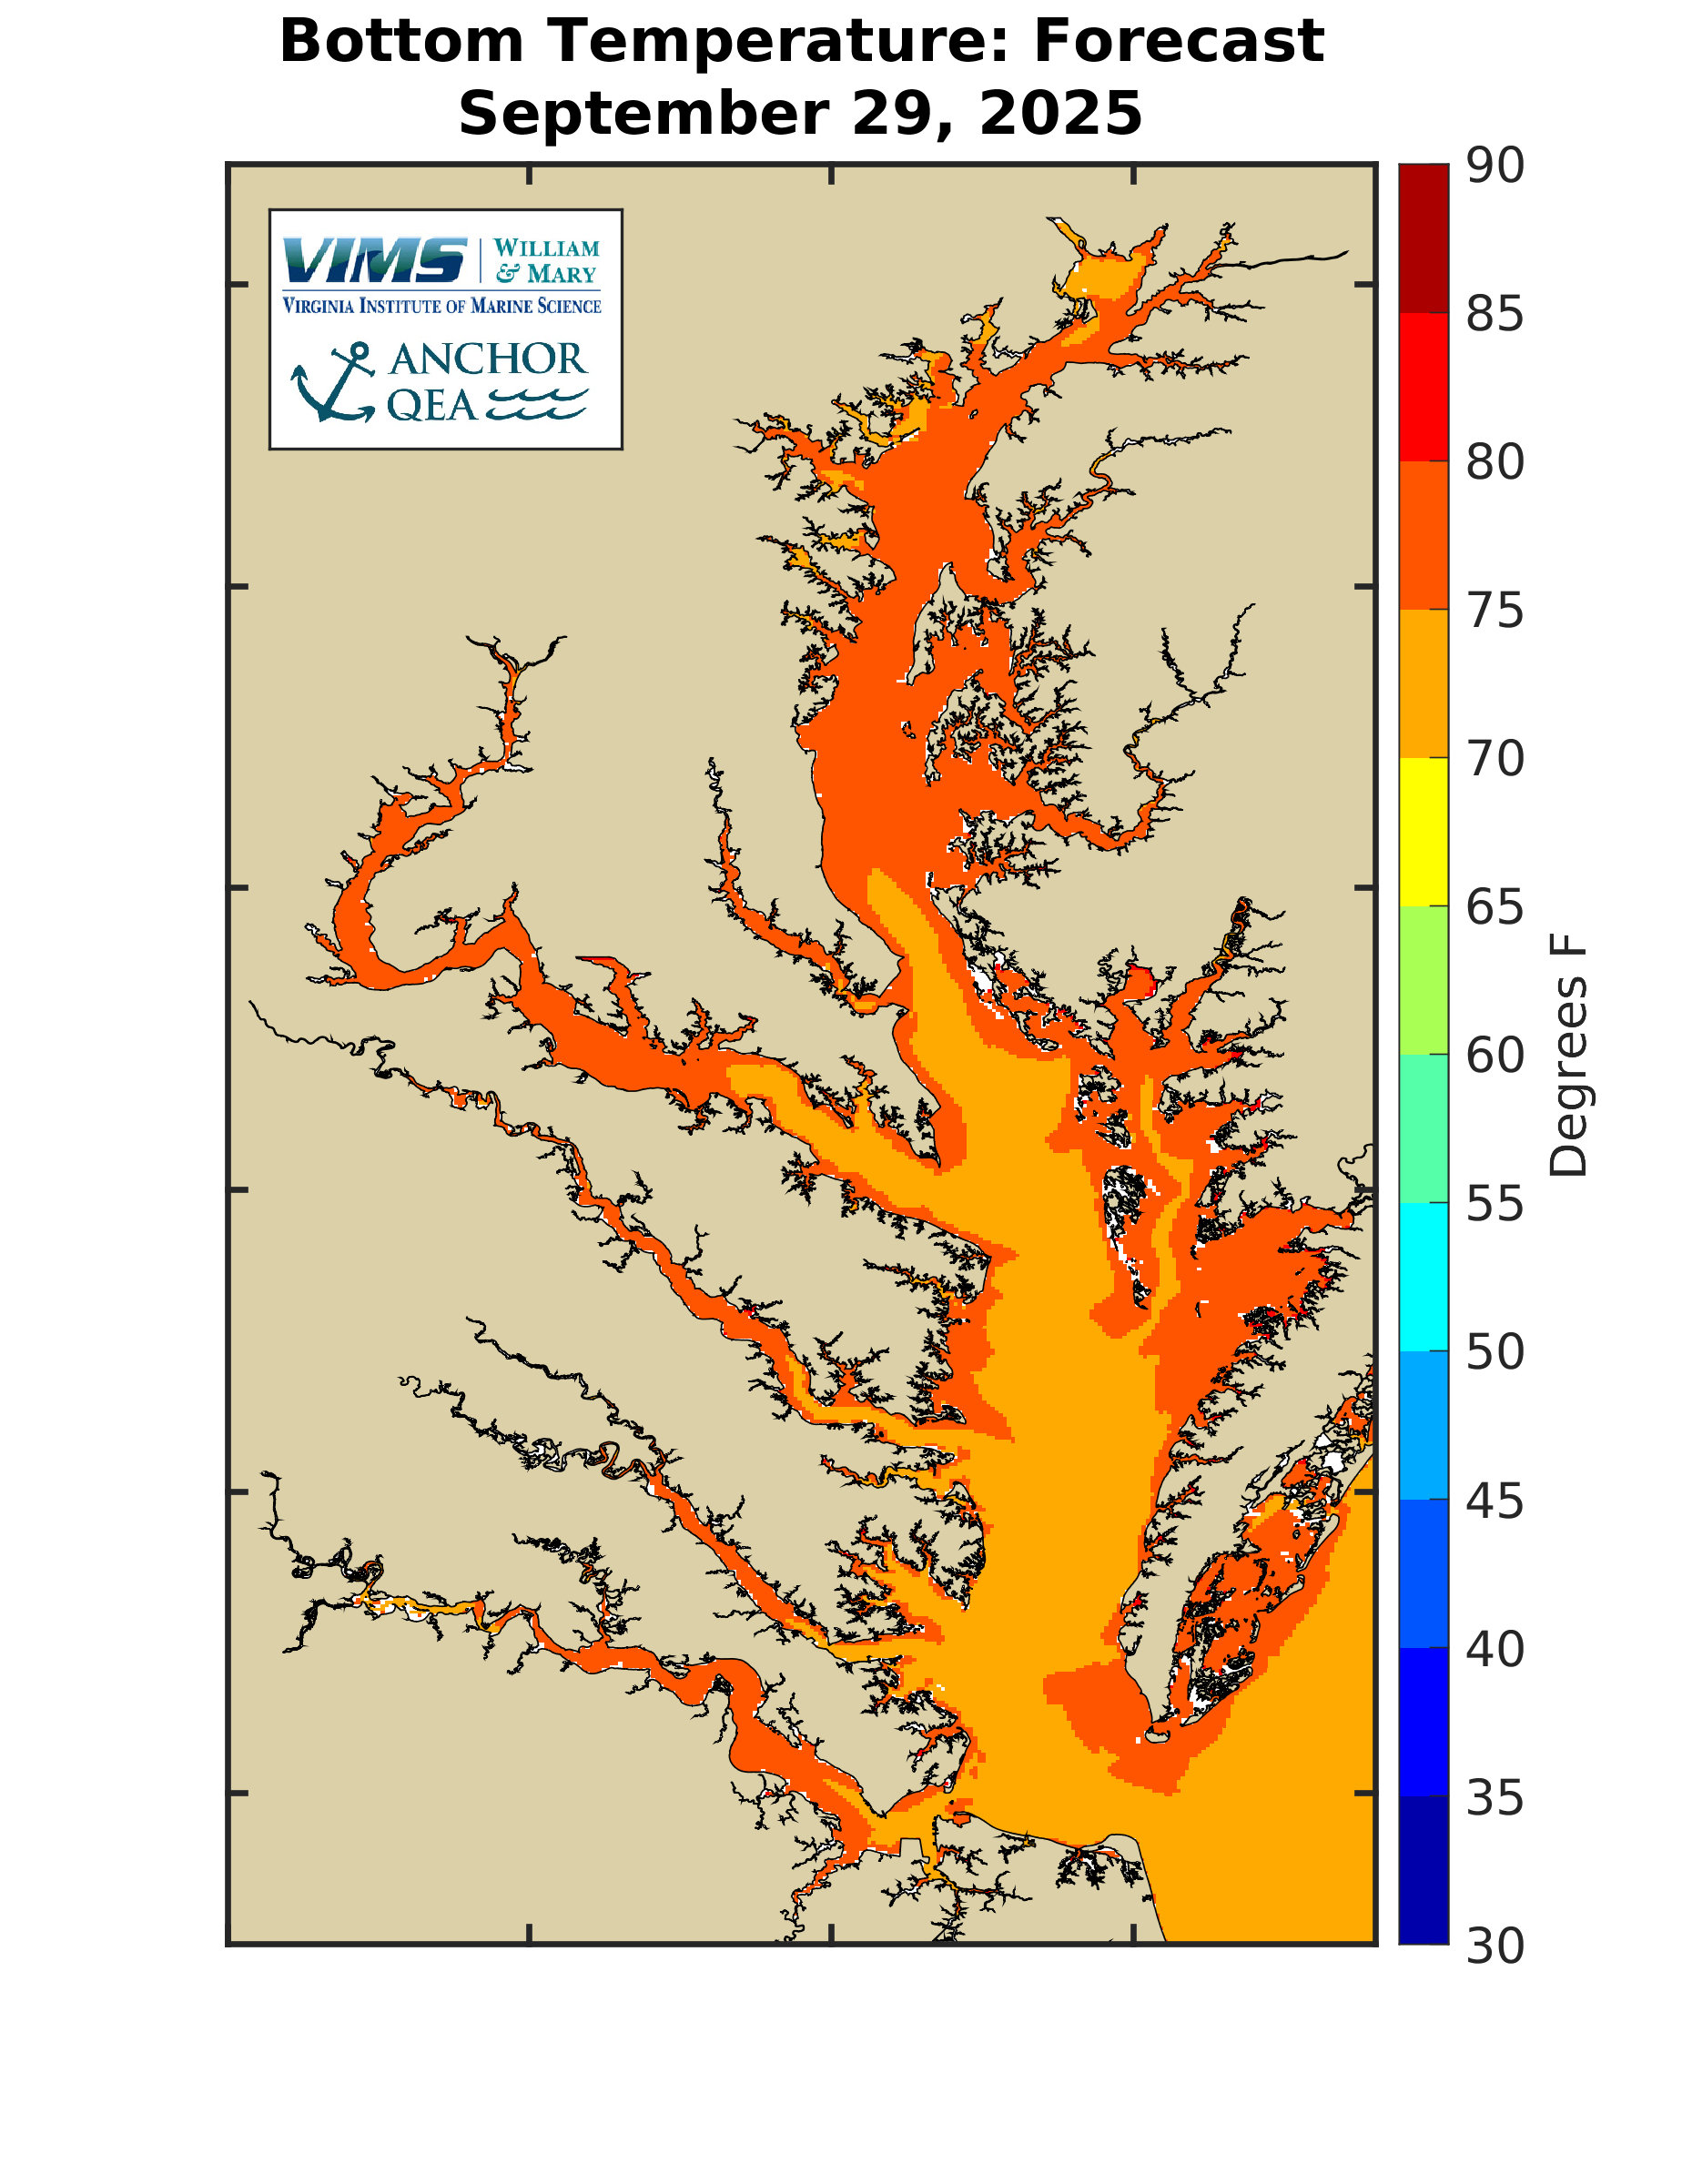
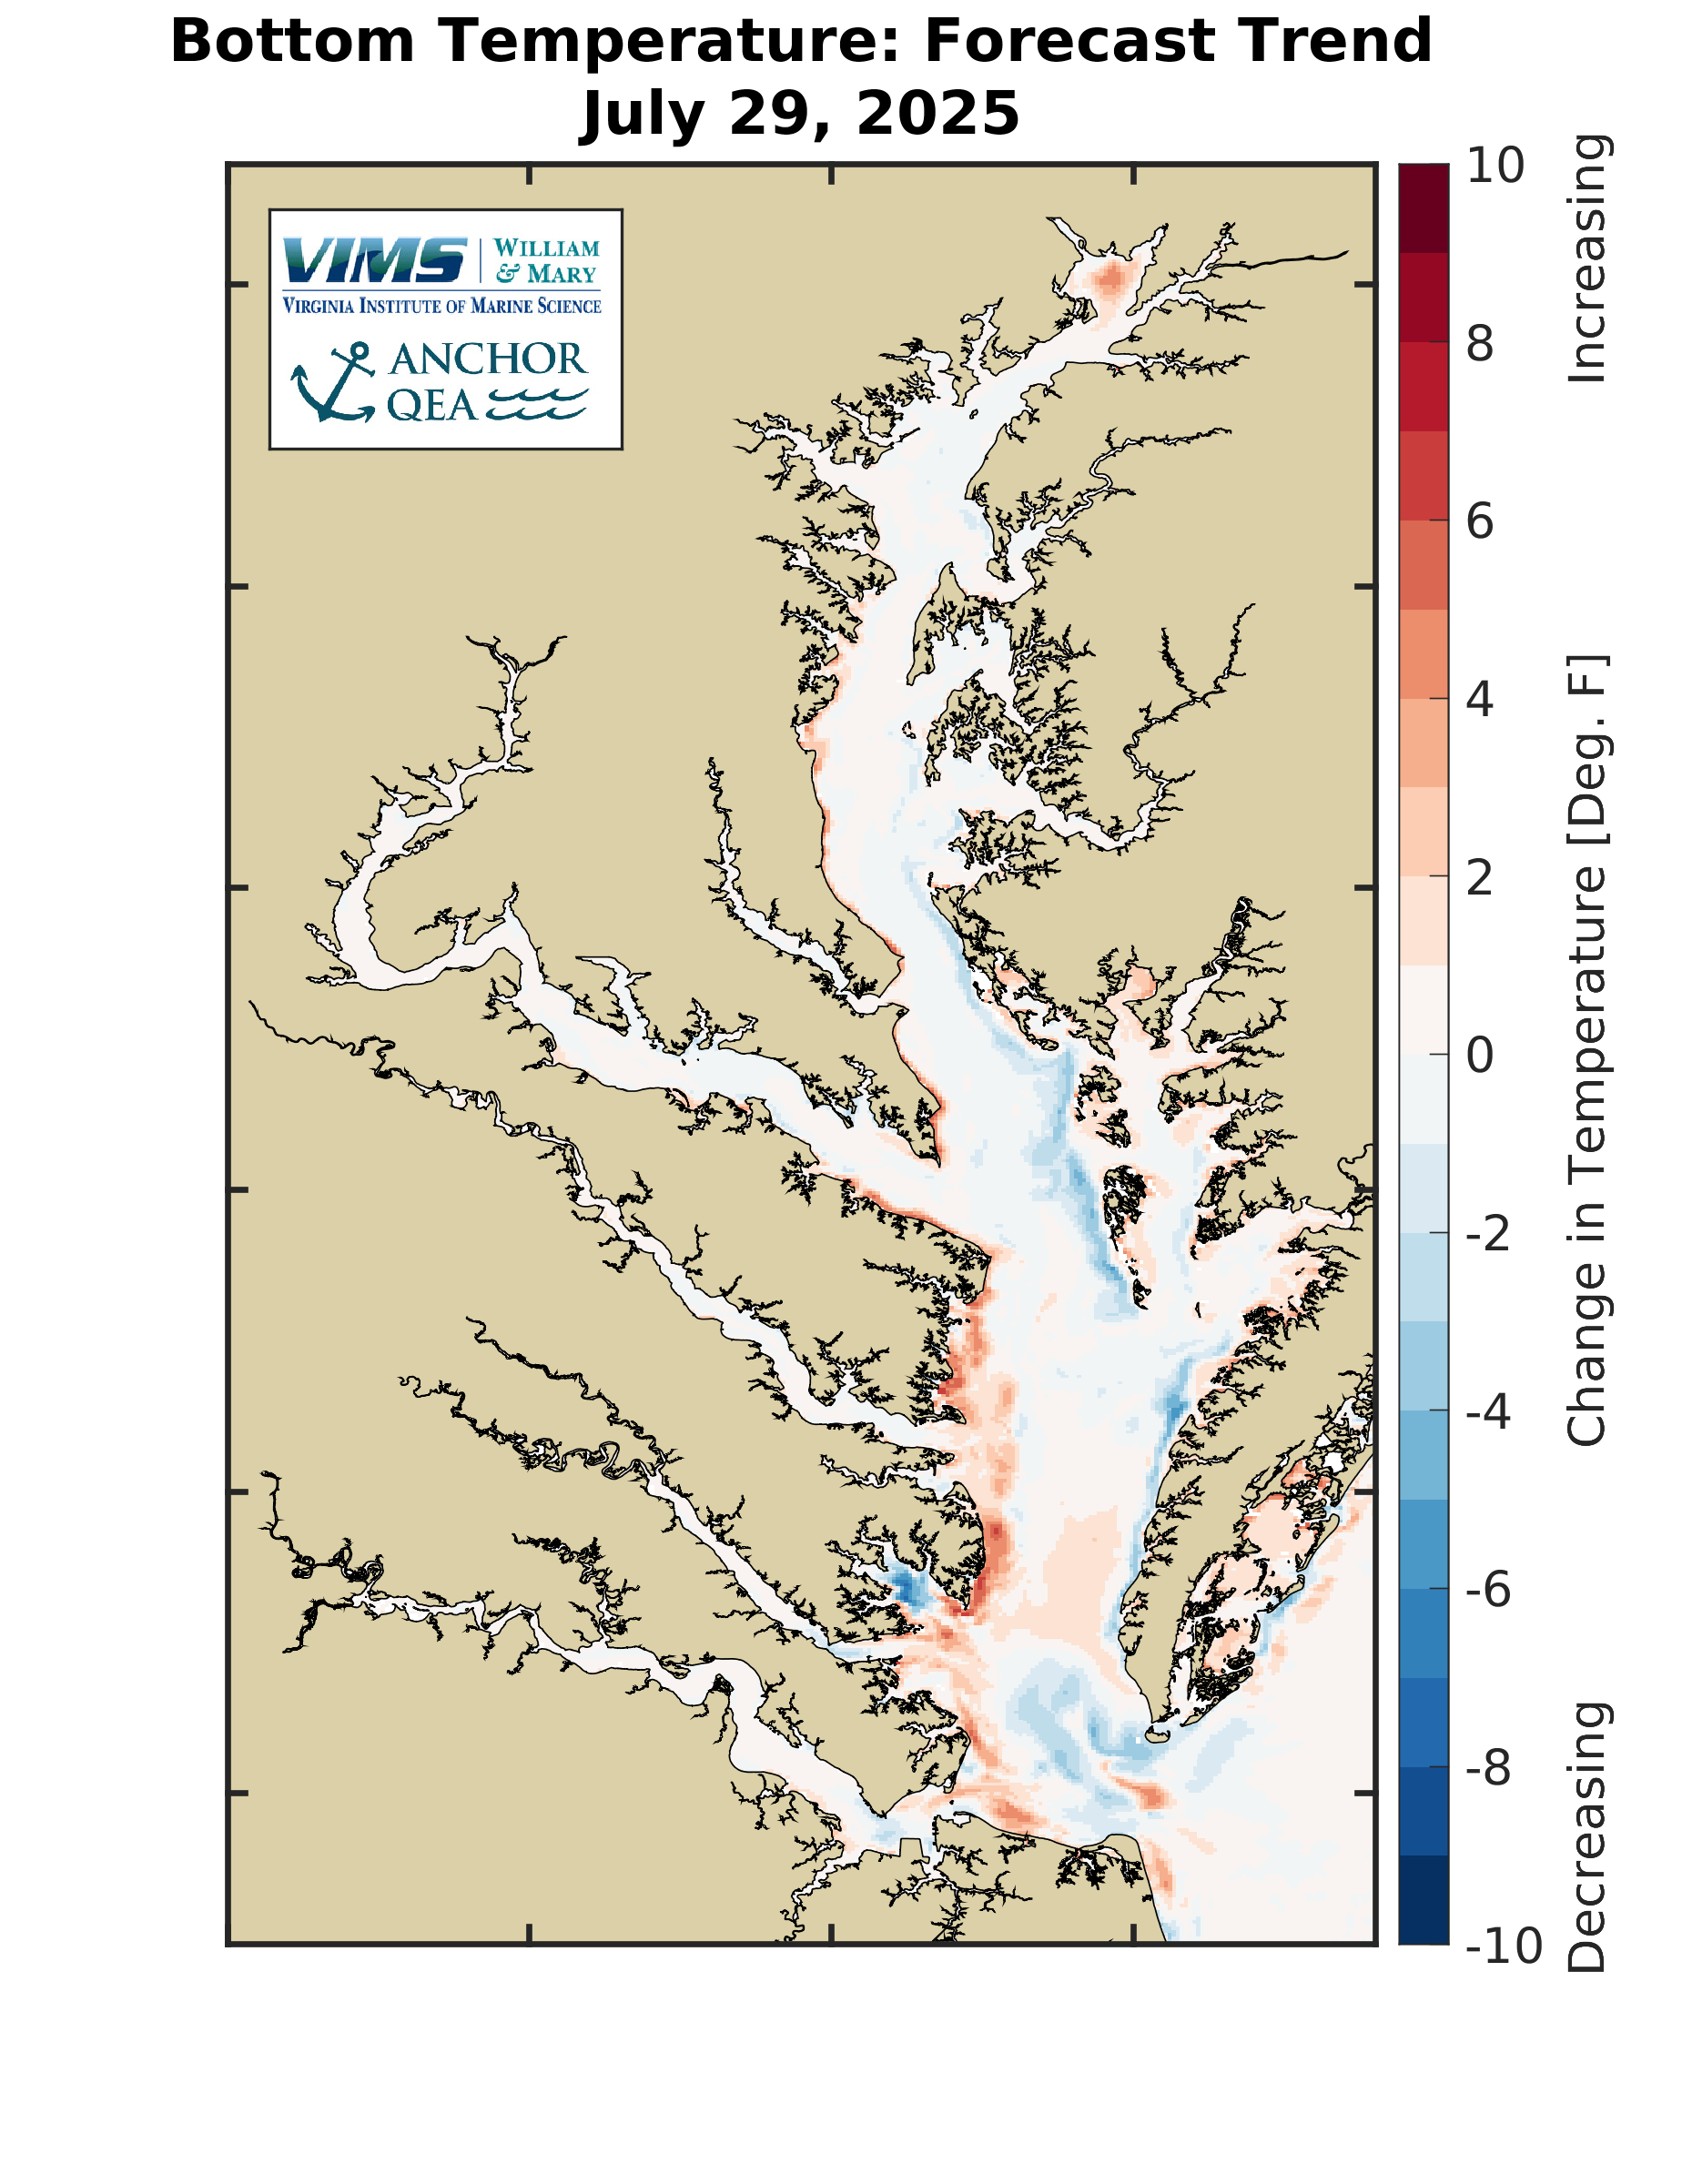
Difference From Long-Term Average
Current conditions are compared to the long-term average conditions to put current conditions in perspective relative to average conditions. Long-term average conditions were calculated using a computer model simulation spanning 1985 through 2022. The below map shows the difference between current conditions and the long-term average conditions on the day noted. For more information on the long-term averages please see the Chesapeake Atlas.