What is NEAMAP?
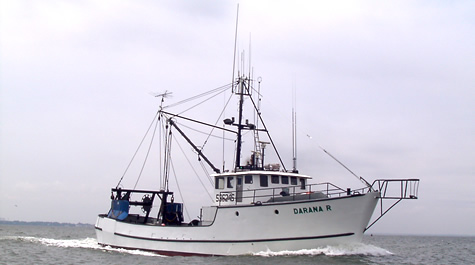
NEAMAP stands for NorthEast Area Mmonitoring and Assessment Program. NEAMAP was developed to meet the needs of fisheries management and stock assessment activities in the northeastern United States. NEAMAP is an integrated, cooperative state/federal data collection program. Currently, three large-scale trawl surveys exist under the NEAMAP banner. These are NEAMAP - Maine / New Hampshire (conducted by the Maine Department of Marine Resources), NEAMAP - Massachusetts (led by the Massachusetts Division of Marine Fisheries) and the NEAMAP - Mid Atlantic which is housed at the Virginia Institute of Marine Science.
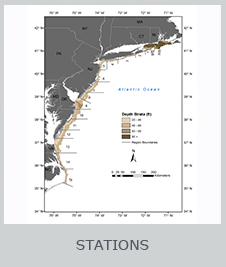
NEAMAP Mid Atlantic began in 2006 with a fall pilot survey and in 2008 began conducting both a spring and fall survey. NEAMAP samples from Cape Cod, MA south to Cape Hatteras, NC and targets both juvenile and adult fishes.Its mission is to facilitate the collection and dissemination of fishery-independent information obtained in the Northeast for use by state and federal fisheries management agencies, the fishing industry (commercial and recreational), researchers, and others requesting such information. The intent of NEAMAP is not to change existing programs, but to coordinate and standardize procedures and improve data quality and accessibility.
{{youtube:large:right|foQMzsQCwxw}}
Survey Goals & Technical ObjectivesGoals
NEAMAP's Technical Objectives
|
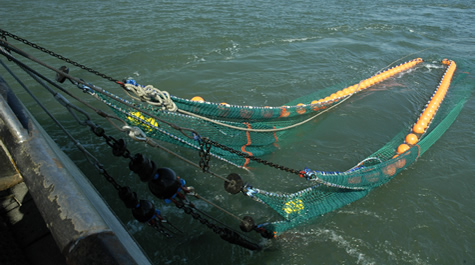
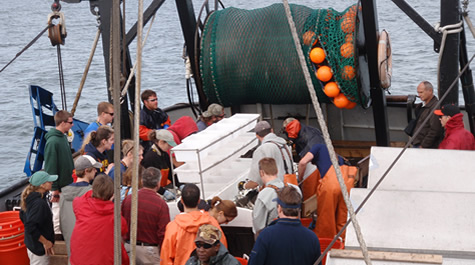
Field Methods
|
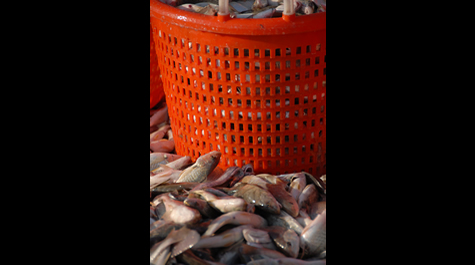
Species Data
The data collected from each of these subsampled specimens includes:
Stomachs are removed and those containing prey are preserved onboard for subsequent diet analysis at the shore-based VIMS laboratory. Otoliths or other appropriate ageing structures (e.g., vertebrae, scales, spines, etc.) are removed from each subsampled specimen for later age determination. Species Selected for Detailed Processing:** abundance indices under construction ** alewifeall skate species American shad Atlantic cod Atlantic croaker Atlantic herring Atlantic mackerel Atlantic menhaden black drum black sea bass blueback herring bluefish haddock monkfish pollock red drum scup silver hake smooth dogfish Spanish mackerel speckled trout spiny dogfish spot striped bass summer flounder tautog weakfish windowpane winter flounder yellowtail flounder For Specimens Not Selected for Detailed Processing:For all species, managed and unmanaged aggregate weights are recorded by species-size group, and individual length measurements (which also yield count data) are taken for either all or a representative subsample.
|
Data UsesFisheries data collected by the NEAMAP Nearshore Trawl Survey has been requested by stock assessment scientists and used in a variety of analytical applications. Specifically, the National Marine Fisheries Service (NMFS), Mid-Atlantic FisheryManagement Council (MAFMC), and/or the Atlantic States Marine Fisheries Commission (ASMFC) have requested NEAMAP data on a wide variety of NEAMAP target species. The data categories are requested on a by-species basis. For example, some assessments require only abundance, distribution, and length data (ie-- squid, mackerel), but others incorporate the full suite of abundance, distribution, length, sex, maturity, and age data (ie--scup, black seabass, summer flounder). Atlantic menhaden assessments incorporate predation and fecundity data. Many other NEAMAP target species (ie--skate complex, striped bass, black drum) are recognized as potentially valuable for future assessments. As this survey has developed, NEAMAP has supported more complex ecosystem-based analyses, contributing to peer-reviewed literature. In addition, the NEAMAP platform supports external research and environmental consulting via filling biological sample requests conducted at sea as well as post-processing data requests. The NEAMAP survey design, along with all data collection and processing protocols, were approved through the peer review process in December 2008. |
Reports
|
FundingNEAMAP is currently funded through the Atlantic States Marine Fisheries Commission.  |
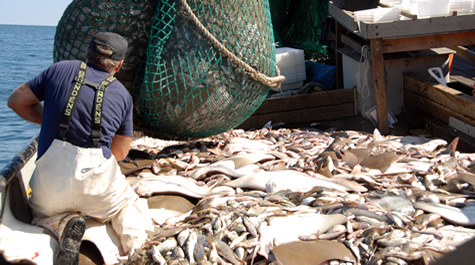
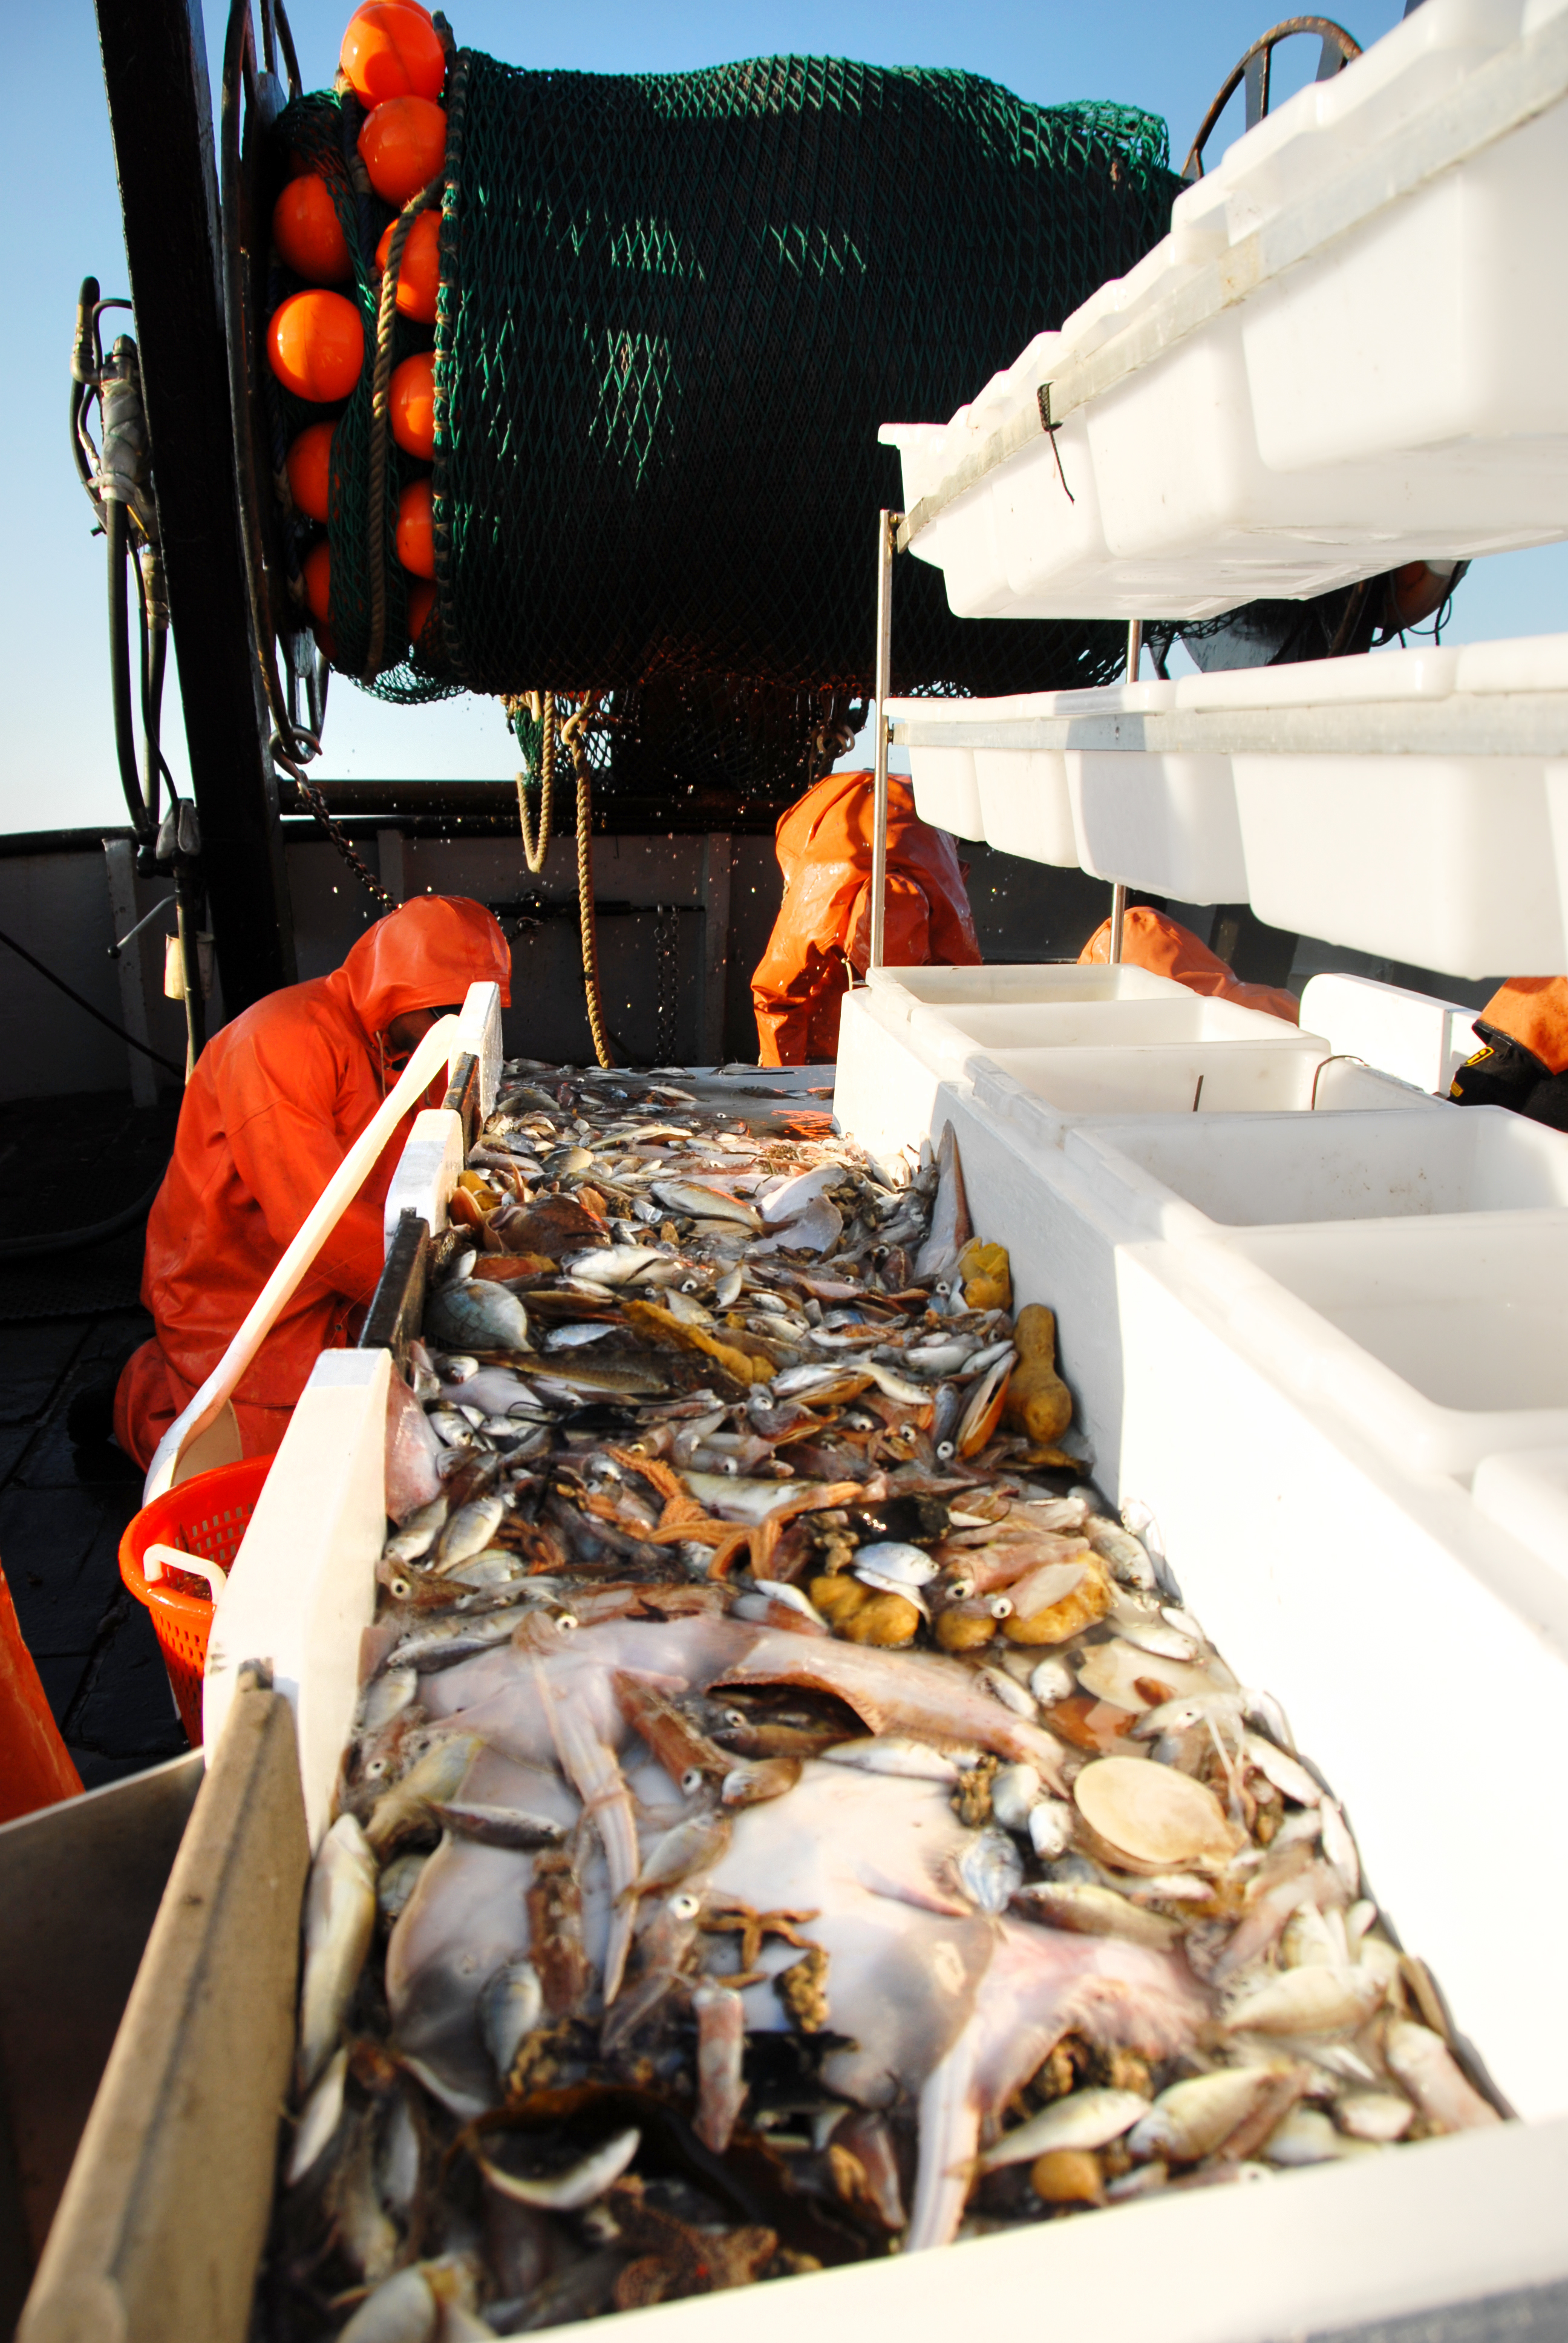 After the completion of each tow, the catch is sorted by species and modal size groups. For species of management interest, a subsample from each size group i selected for detailed processing. Experience shows that a subsample of 3-5 individuals (3 for very common species, 5 for all others) per species-size group per tow is sufficient for this full processing.